Reading the Terrain at Percona
I worked with database experts and enterprise customers to design PMM’s Real-time Analytics: a workflow for choosing what to monitor, inspecting live operations and keeping control of a changing view.
At a glance
The problem: Query Analytics helped teams investigate completed queries. Enterprise MongoDB teams also needed to see operations while they were running, with control over when additional collection started and stopped.
My role: As the only designer, I led discovery synthesis, problem framing, interaction design and prototypes. I worked with our product manager, technical leads, engineers and QA, and followed the release with front-end fixes.
The delivery: Real-time Analytics first shipped for MongoDB in PMM 3.7. CSV export followed in PMM 3.9, extending the workflow with a way to preserve evidence from an investigation.
Two questions behind a slow database
PMM (Percona Monitoring and Management) helps database teams monitor performance and investigate problems. Its Query Analytics screen shows patterns in completed queries: what was slow, how often it ran and where it spent time.
An active incident brings a different question: what is running right now?
Enterprise MongoDB teams needed that live view before PMM could replace more of their monitoring toolset. Meanwhile, the existing historical interface had its own problems: dense filters, difficult comparisons and detail views that experts found unreliable. A colleague said it “feels like it’s from the ’90s.”
The wider redesign began with those problems. Real-time Analytics became the part we could deliver first.
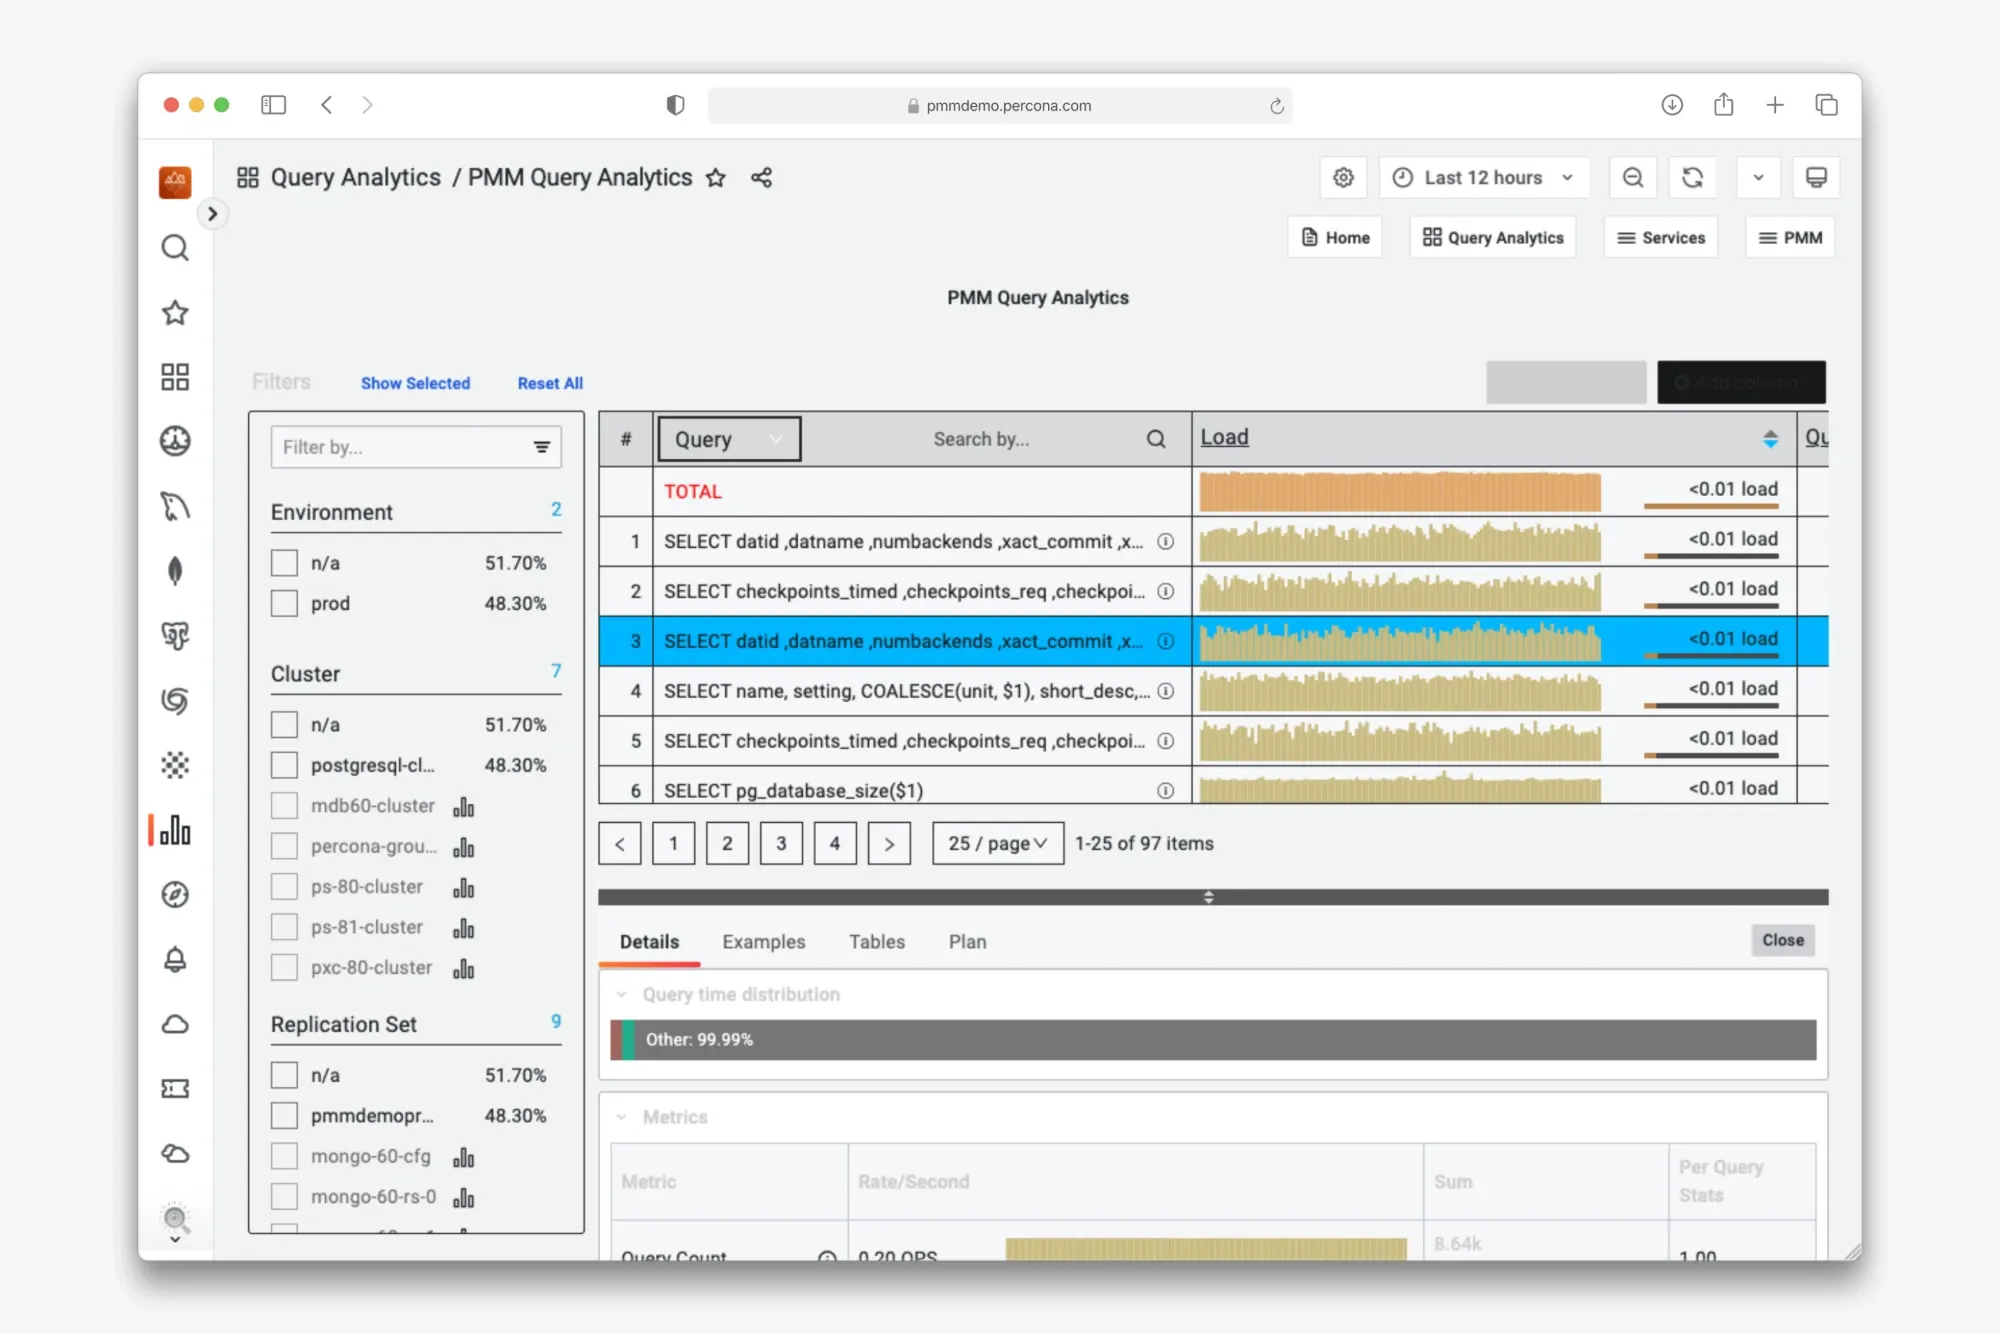
The existing Query Analytics screen combined dense filters, query metrics and a details panel. Its prominent Load metric did not match how the support expert I worked with assessed a slow query.
Learn how experts investigate
I brought together earlier interviews, support knowledge, the backlog and findings from a 2023 wireframe evaluation with 13 colleagues. That earlier work had explored historical comparisons as a feature. It gave us useful starting points when the redesign resumed in 2025.
I mapped Query Analytics into the information users could inspect and the actions they could take. This gave the team a shared model of the screen before we committed to a new layout.
I then used wireframes in workshops with our internal database experts to surface assumptions and technical constraints. A walkthrough with a support specialist was especially useful: the prominent Load metric contributed little to their investigation. They reasoned through query duration, variation and rows examined.
That changed the question I was designing around: which information helps someone judge the problem and decide what to inspect next?
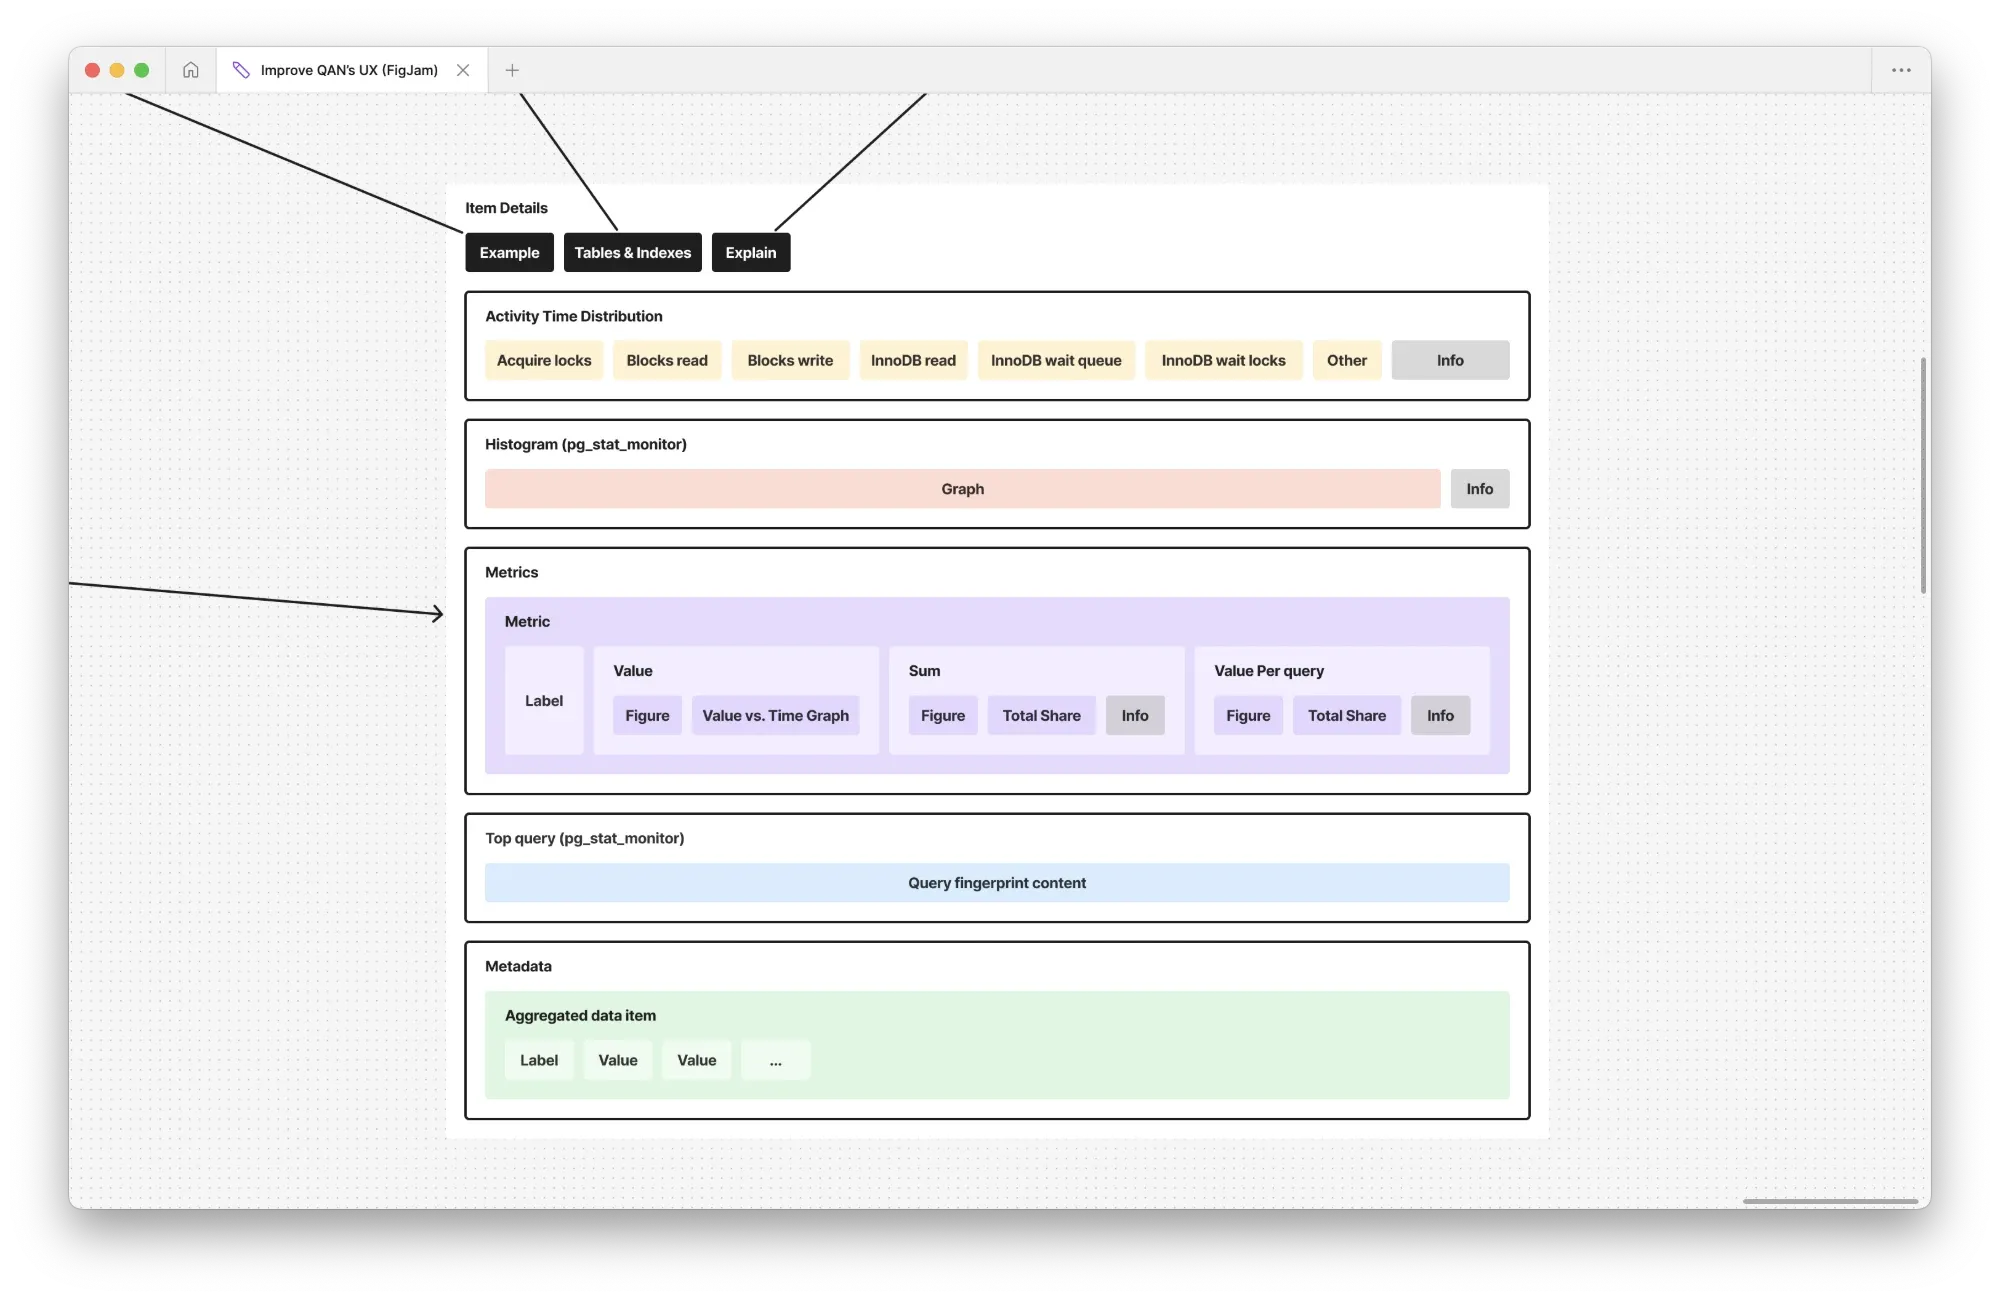
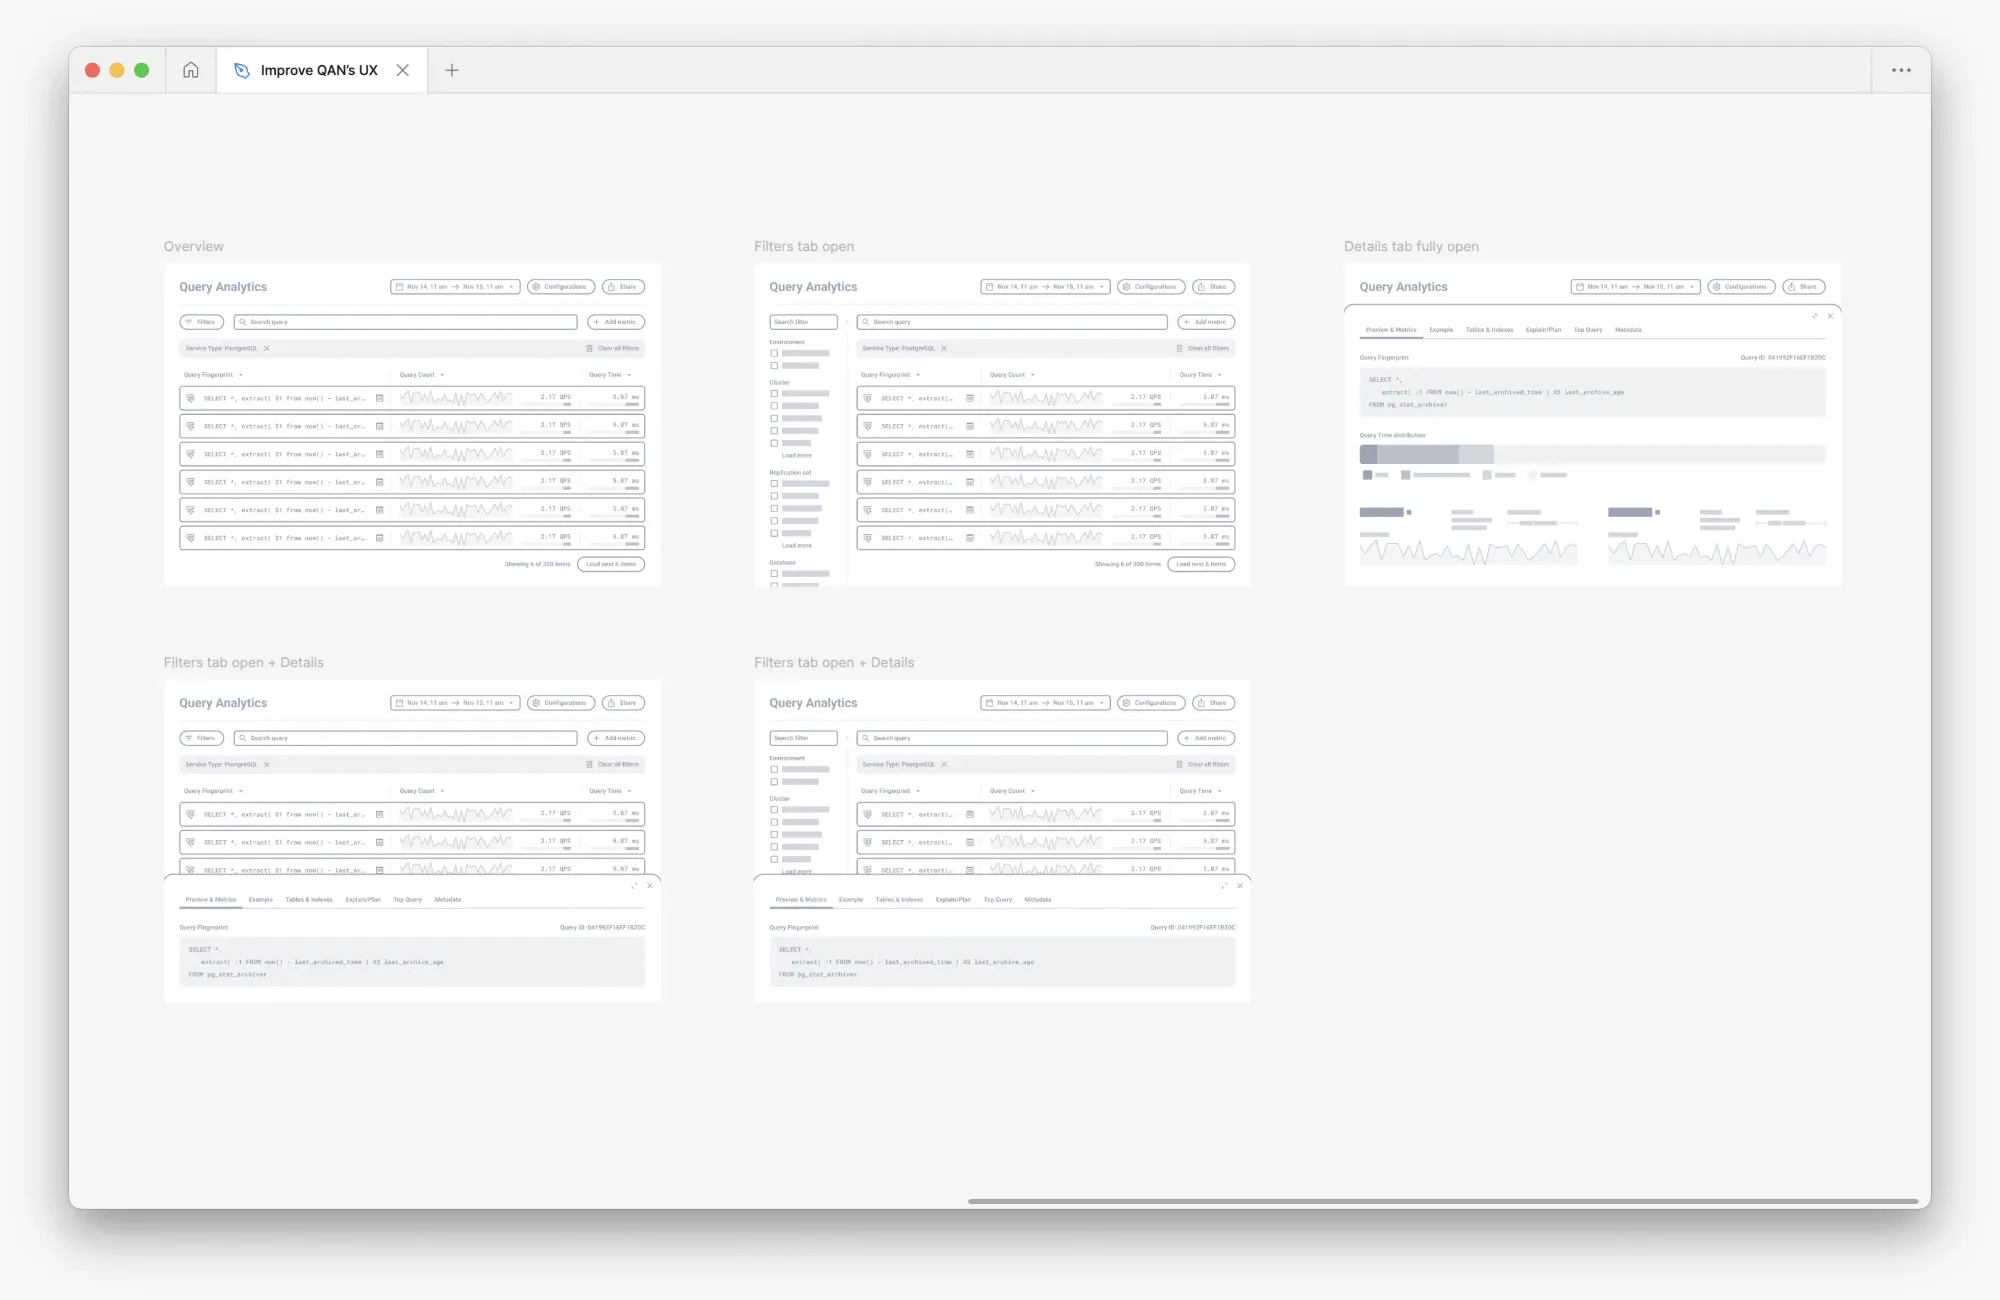
I mapped the information and actions in Query Analytics, then used early wireframes to discuss filters, query inspection and technical constraints with database experts.
Make customer conversations specific
With our product manager, I turned problems raised by DBAs, developers and DevOps engineers into narrated prototype videos. These showed recognizable investigation scenarios and gave customers something concrete to respond to.
Customers recognized their own problems in the videos and “wanted it for tomorrow.” The conversations also helped identify priorities. Customers wanted better query investigation, and enterprise MongoDB teams made the need for live operations particularly clear. Their feedback also exposed a practical constraint: additional collection had to be under their control.
The prototypes helped us discuss what to build and why. Detailed interaction decisions came next, as we narrowed the scope with customers and technical leads. When I showed an early live-view prototype to one enterprise team running about 1,100 servers, they said, “It looks fantastic, actually.”
Choose services without losing the cluster structure
One customer environment had more than 300 clusters alongside standalone services. Starting a live investigation meant selecting the right services from that structure to avoid performance issues.
I explored three approaches: a cascading selection, an initial choice between clustered and standalone services, and a searchable tree with multiple selection.
An internal review produced no clear preference. I compared the options against the task and the cluster-and-node model I had learned from database experts. I chose the tree because it kept that relationship visible while allowing people to select several services together.
The decision connected domain knowledge to a concrete interaction: users could search for a service, understand where it belonged and select the scope of their investigation in the same control.
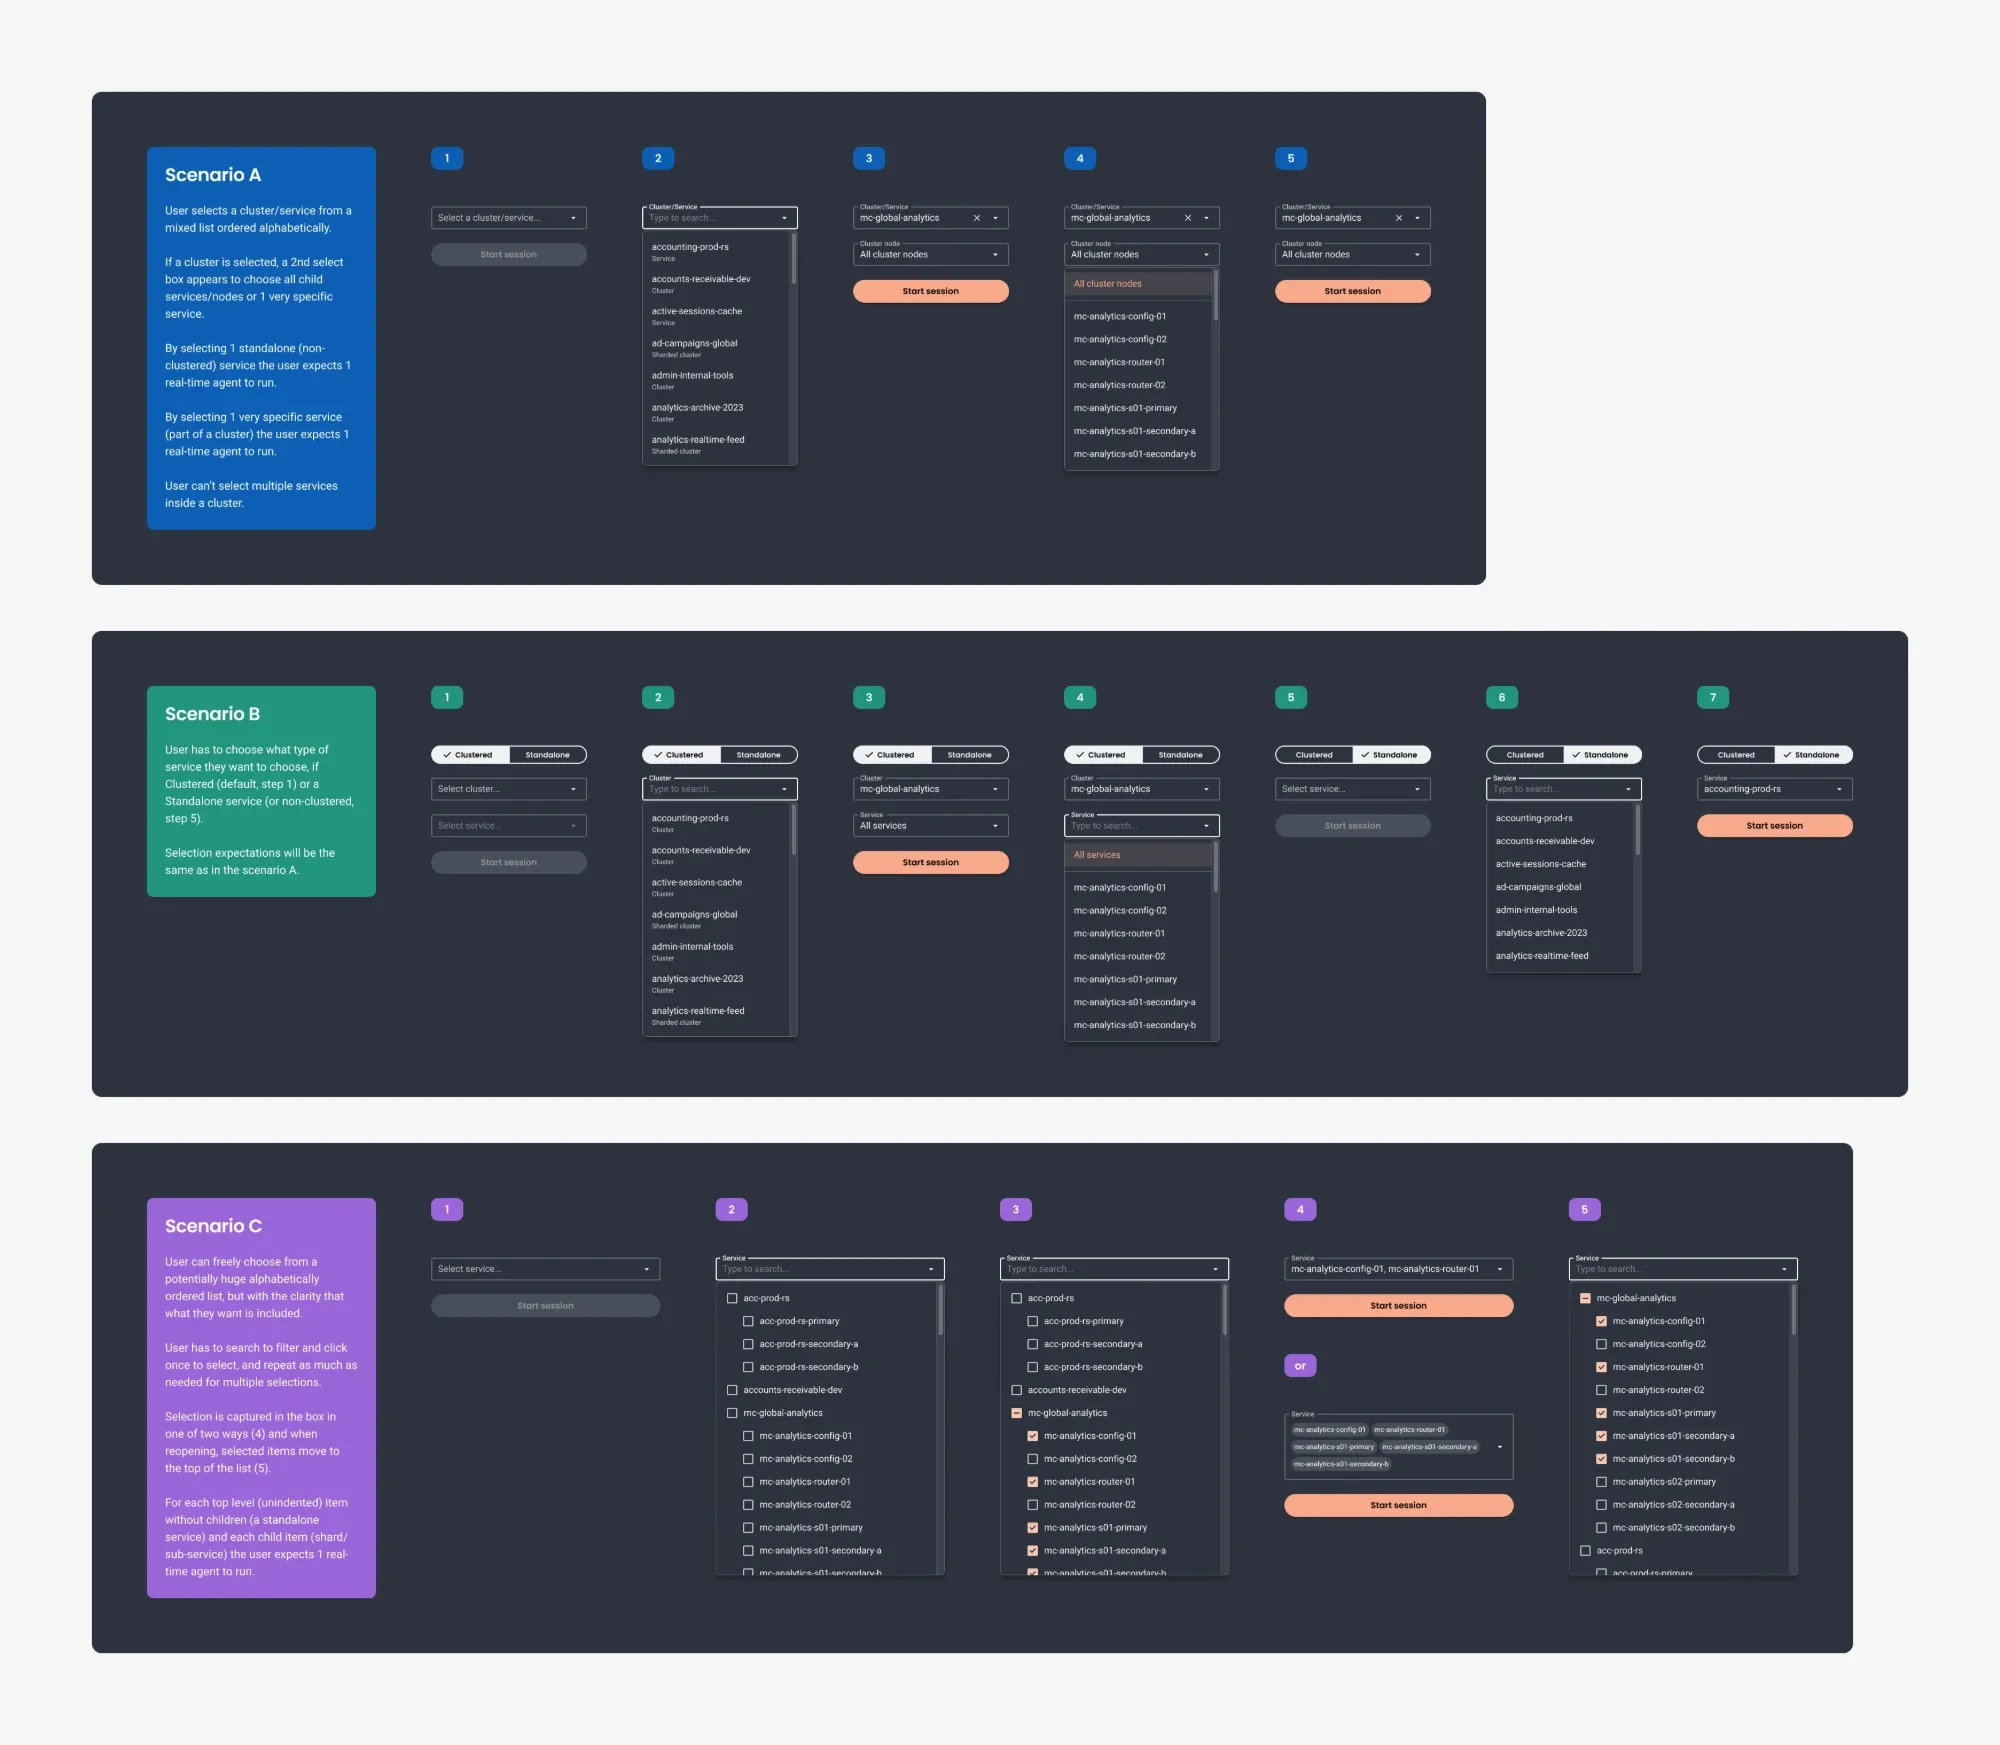
Three approaches to selecting services: cascading fields, separate paths for clustered and standalone services, and a searchable tree. I chose the tree to preserve cluster context while supporting multiple selection.
Keep a live view usable while it changes
A live table can lose the operation someone is trying to inspect at the next refresh. The workflow needed to balance current data with a stable view for investigation.
I designed controls for a refresh interval of one to five seconds, explicit pause and resume, and manual refresh. The prototype also explored a temporary pause while the pointer was over the table.
Pausing the view and stopping collection were separate actions. A paused view lets someone inspect a snapshot; session controls manage the additional collection running against the selected services.
Making that distinction visible was part of making the workflow understandable under pressure.
Separate the first release from the wider redesign
I explored combining historical and live analysis in one list, with Real-time available through the time picker. That approach would also require substantial changes to the legacy historical screen.
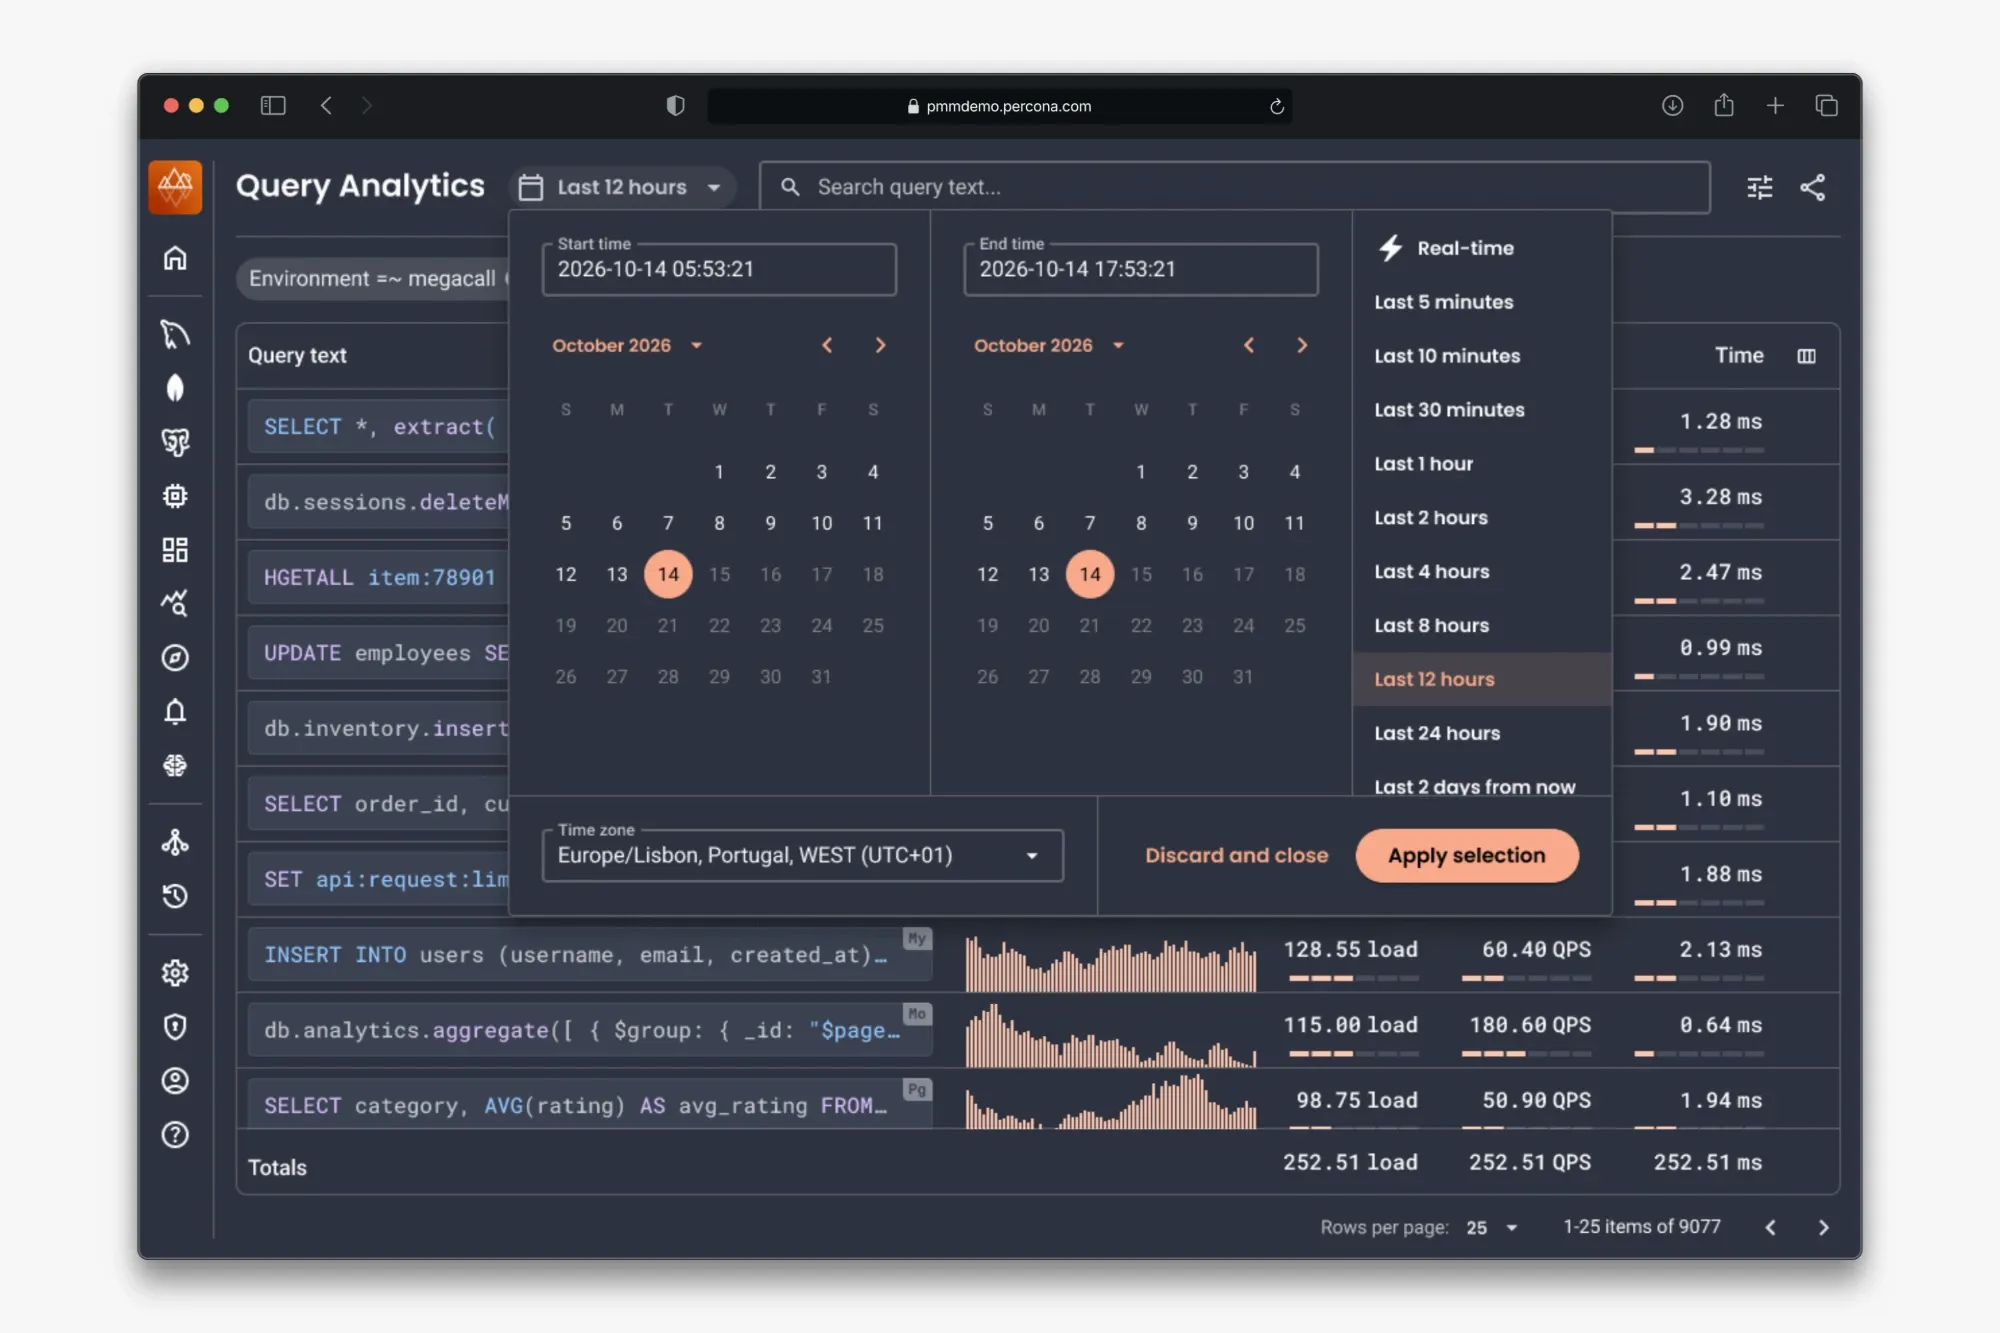
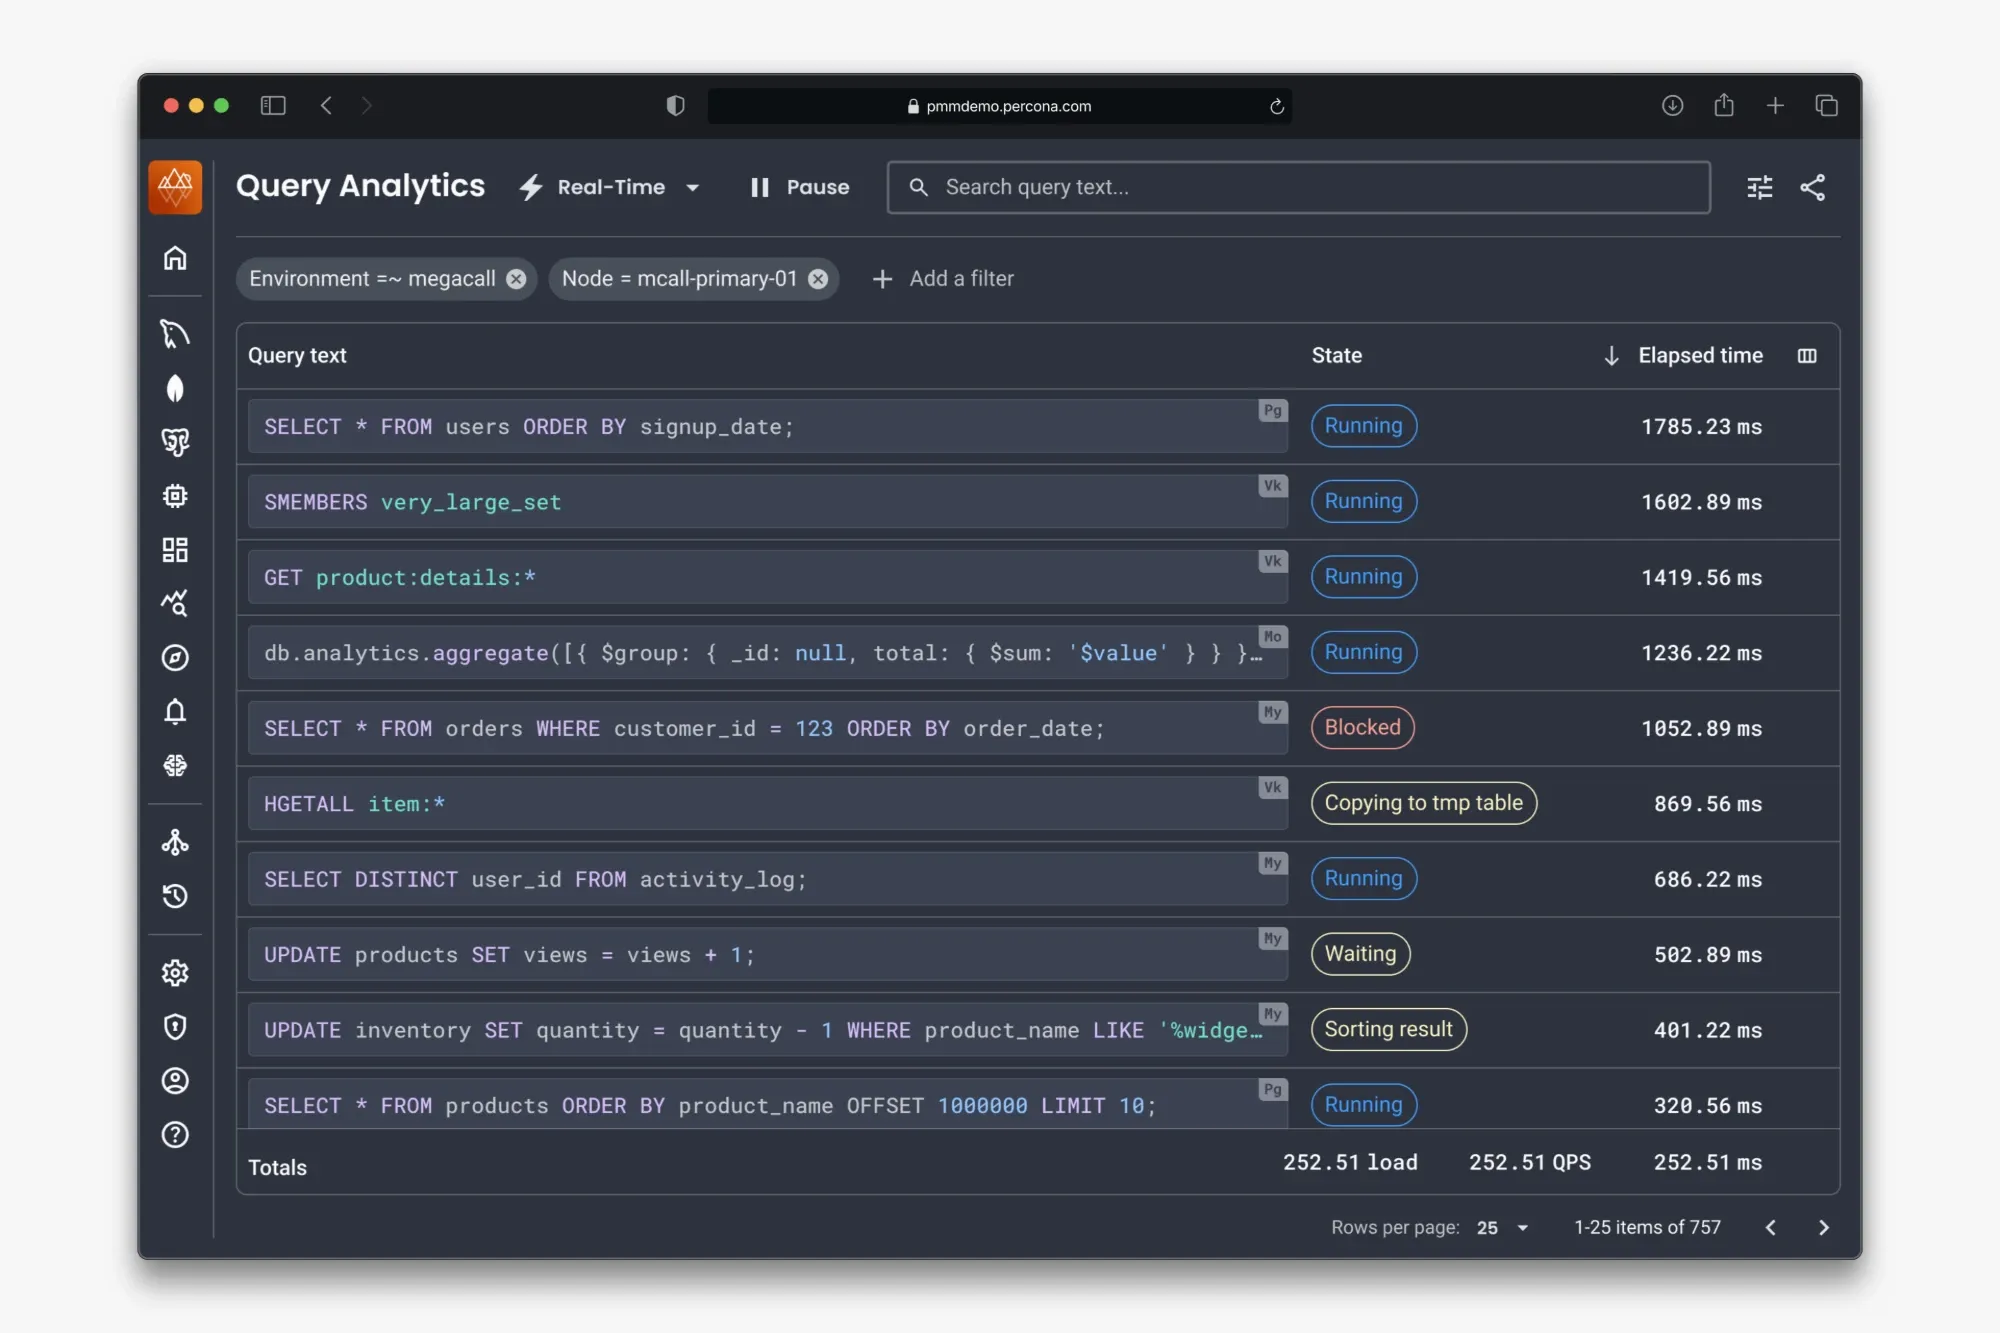
An alternative I explored: switching the same query list between historical and live data through the time picker. We kept the first release in separate tabs to avoid coupling it to the wider historical redesign.
We chose separate tabs for the first release. This let the team introduce live investigation while retaining the existing historical experience.
The session workflow covered starting collection, inspecting an operation and its raw data, and stopping individual sessions or all sessions together. I used prototypes to work through these behaviors with the technical leads and engineers.
Ship the workflow, then extend it
Real-time Analytics first shipped for MongoDB in PMM 3.7, in April 2026. Implementation constraints left some differences from the design, and I followed the release with cosmetic fixes in the production front-end.
CSV export followed in PMM 3.9, in July 2026. It gave teams a way to preserve a snapshot of operations that might disappear from the live view. Command-line session controls also supported investigations outside the interface.
Customers then asked for other parts of PMM to work in a similar way and become as user-friendly. That was useful qualitative feedback alongside a concrete delivery: a new investigation workflow, followed by capabilities requested by customers.
The work also benefited from Peak UI, the shared foundation. Engineers could extend the established layout and components as the feature developed, so export and the command-line controls shipped with minimal review from design.
Carry the learning into the next work
The wider redesign of historical Query Analytics remained on the roadmap at the end of my involvement. I proposed structured filters, a customizable overview and a details panel that could expand without losing the surrounding investigation.
For that proposal, I kept mixed database environments in scope. Customer research supported the preference for searchable filters and shareable URLs, so people could focus on the relevant services and hand the investigation to a colleague.
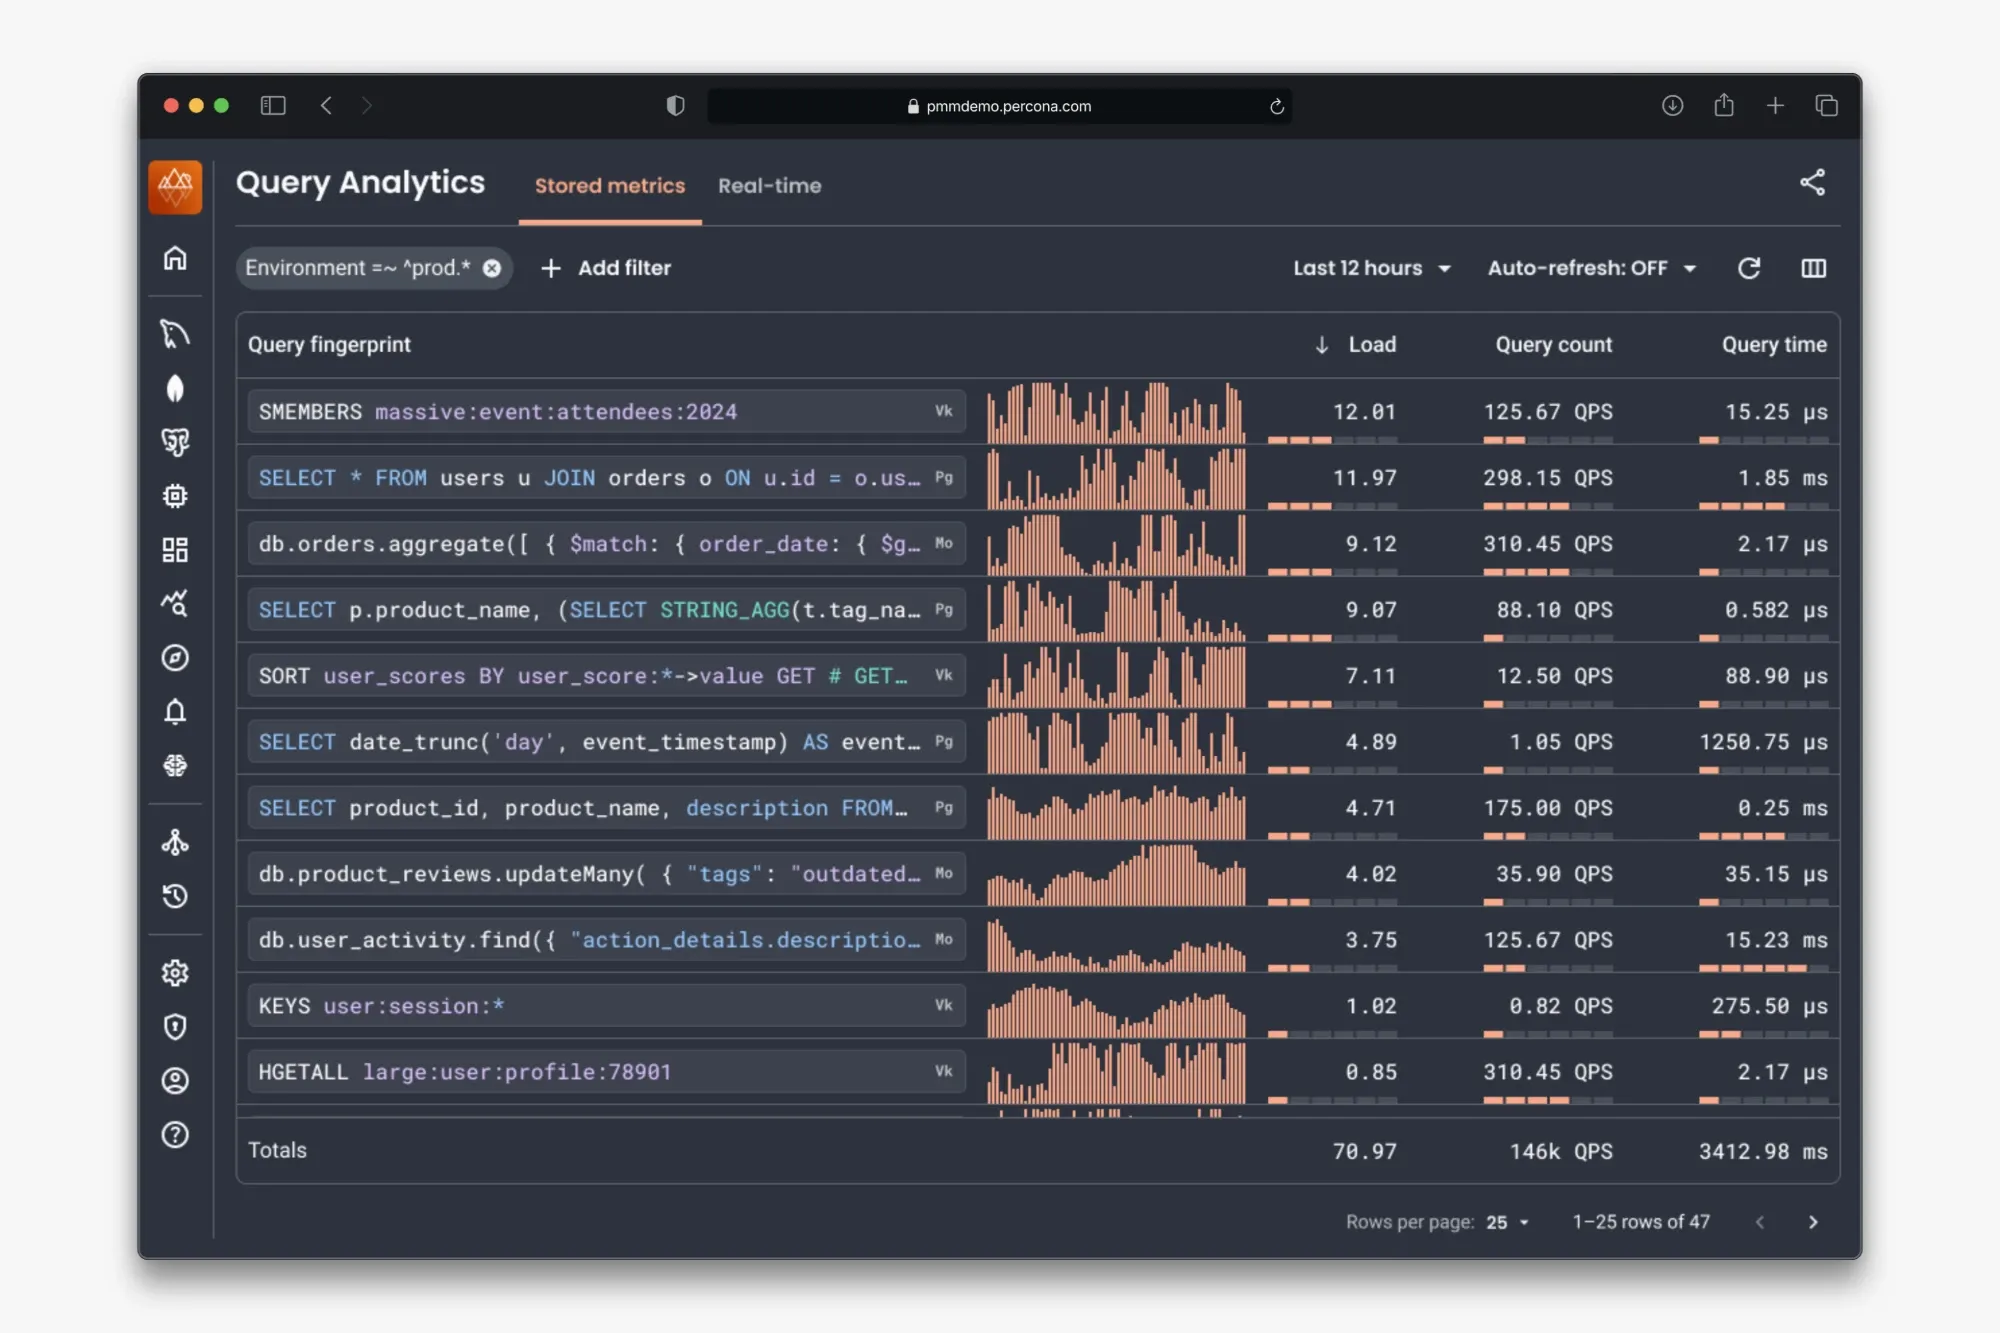
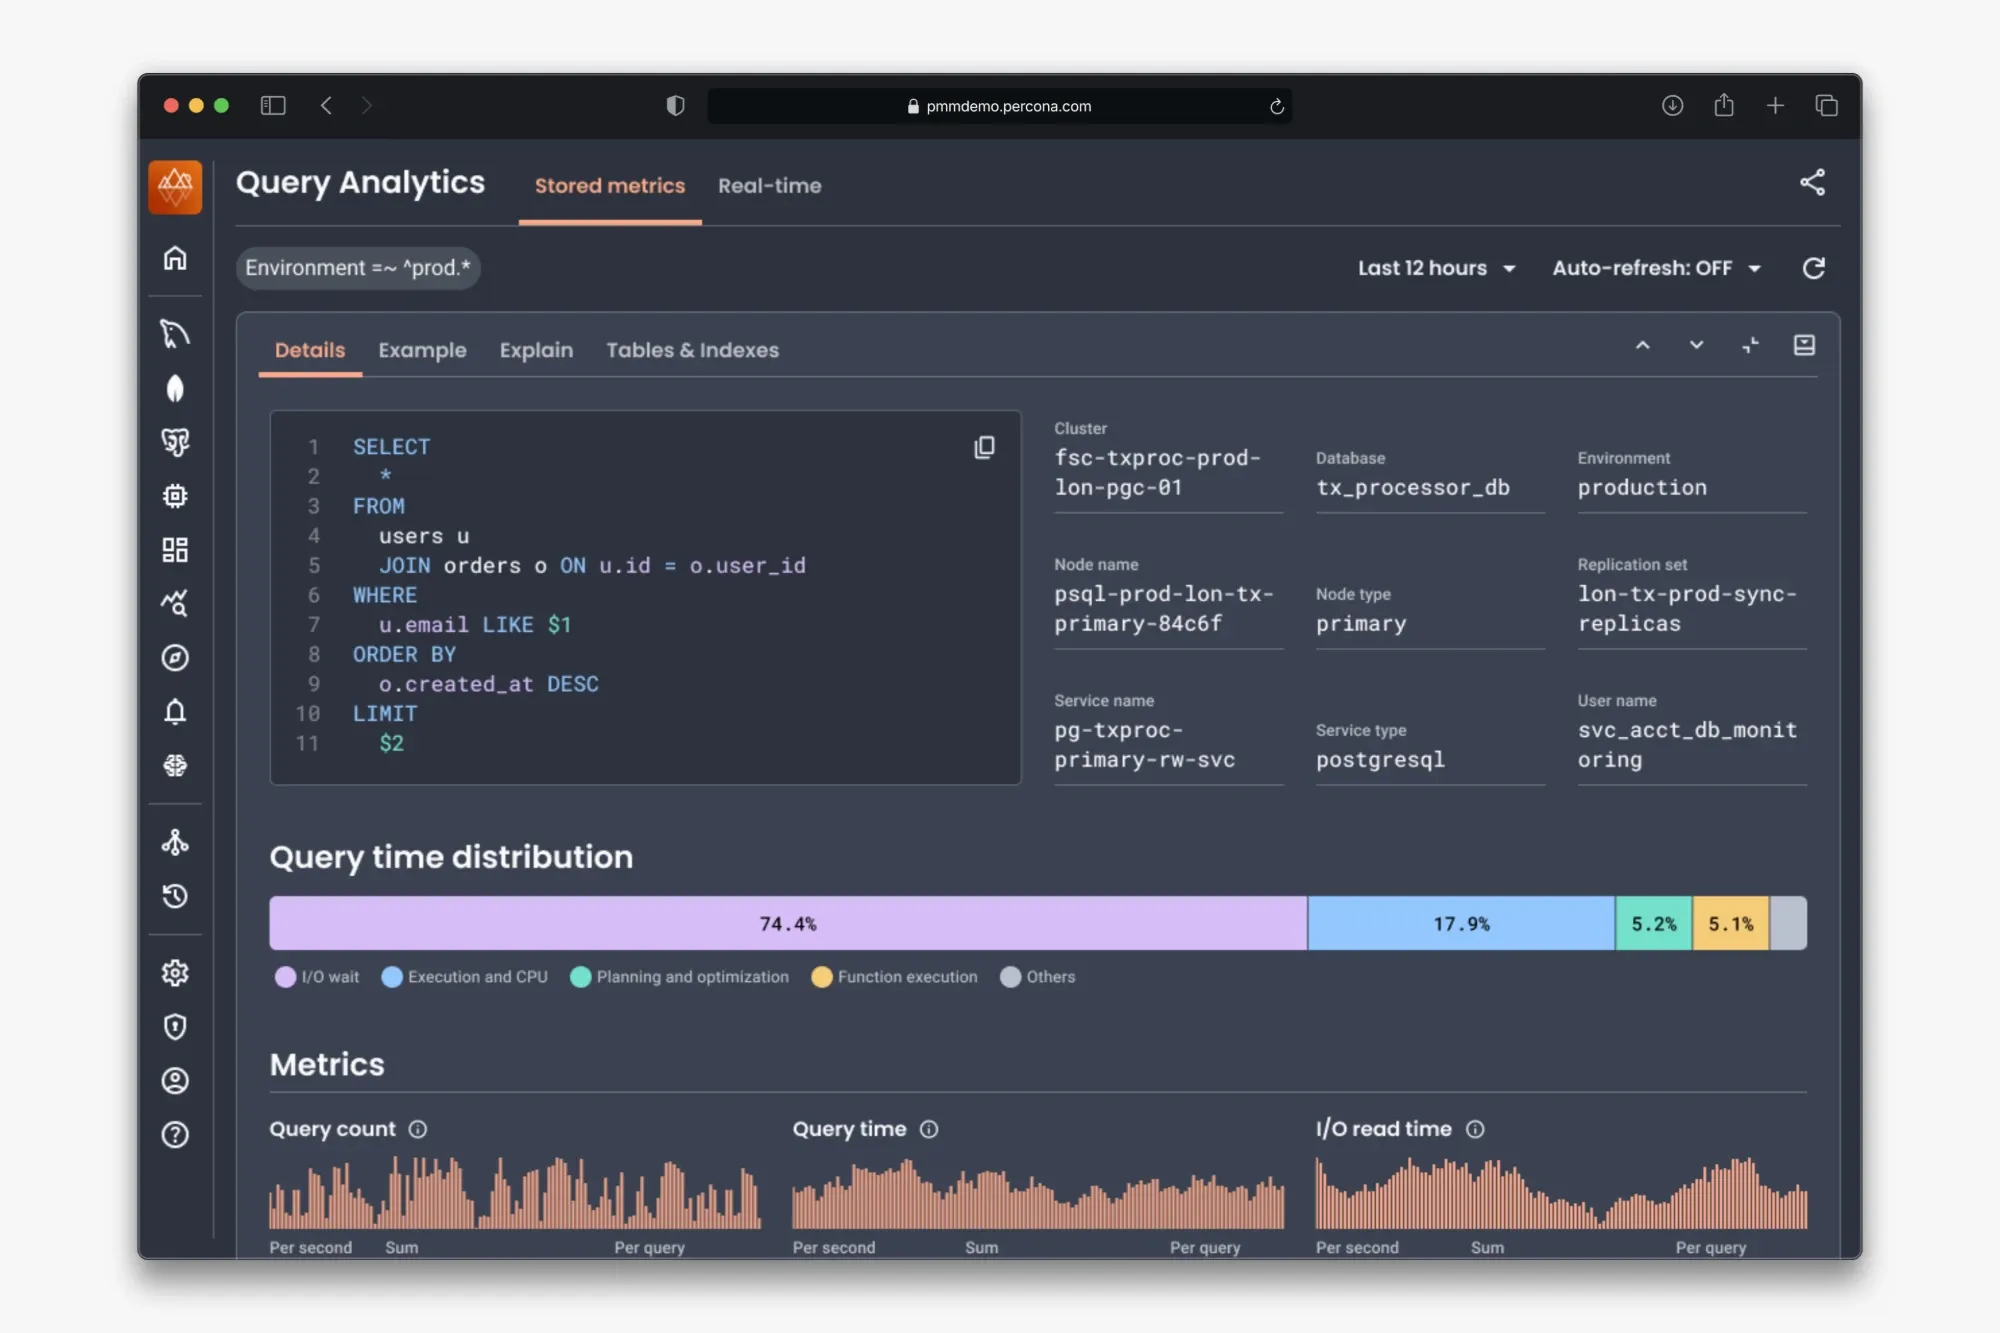
Proposed historical overview and expanded query details. The design supports scanning query metrics and inspecting where a query spends time without leaving the investigation.
A related application: Advisors
I applied a similar question to Advisors: once the product identifies a problem, does it help someone act on it?
The existing view listed failure counts by service. For customers with more than 1,000 servers, reviewing services individually was impractical. On a tight delivery timeline, I proposed an inbox-like list of findings with an explanation, a recommendation and actions to mark a finding as done, re-check it or share it.
Stakeholders approved the prototype, and it was in development at the end of my involvement.
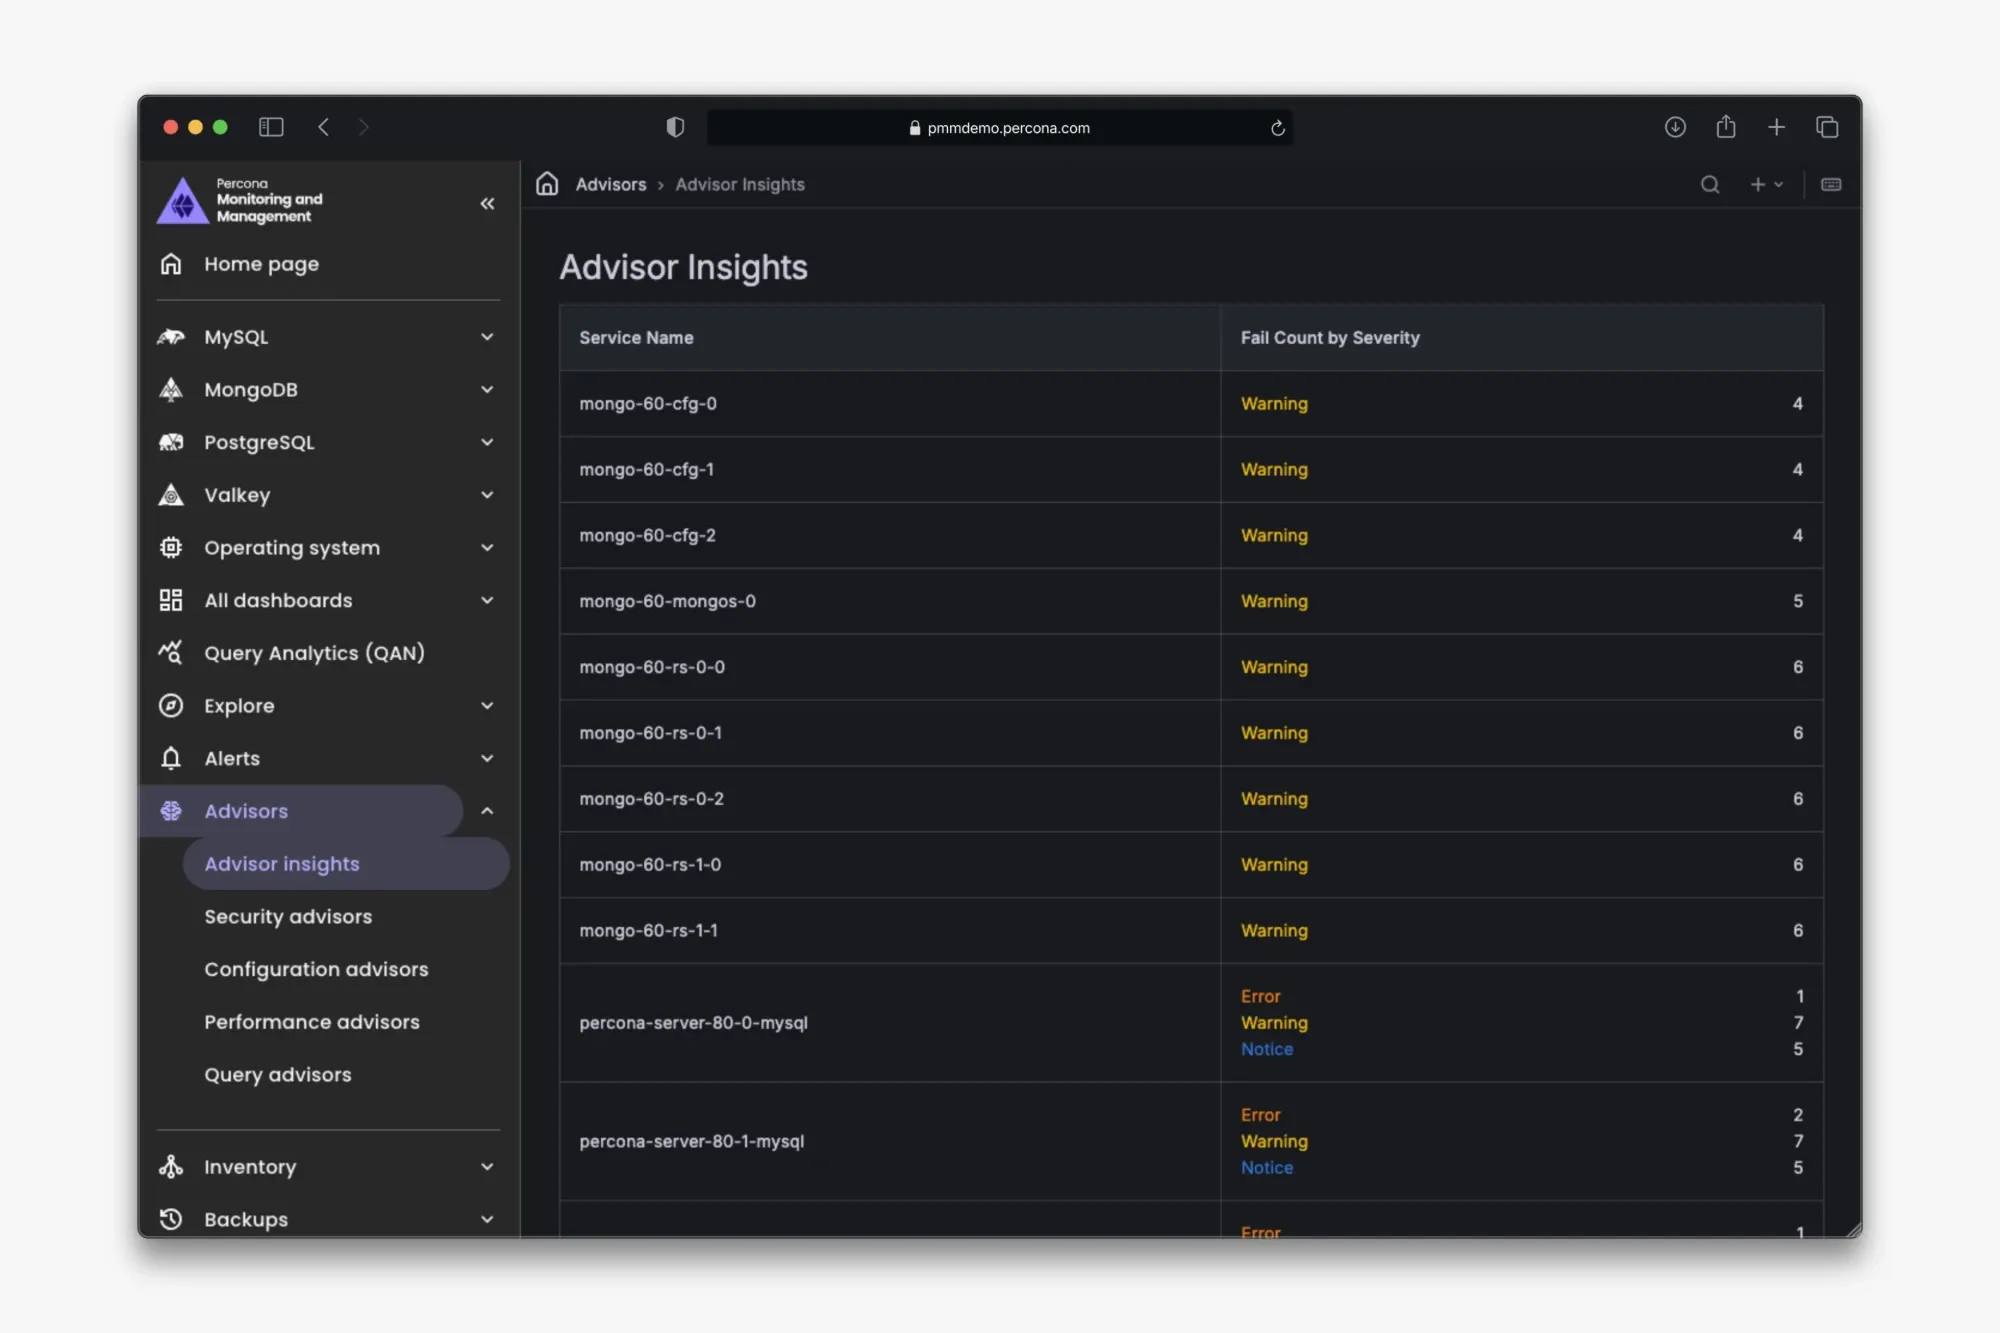
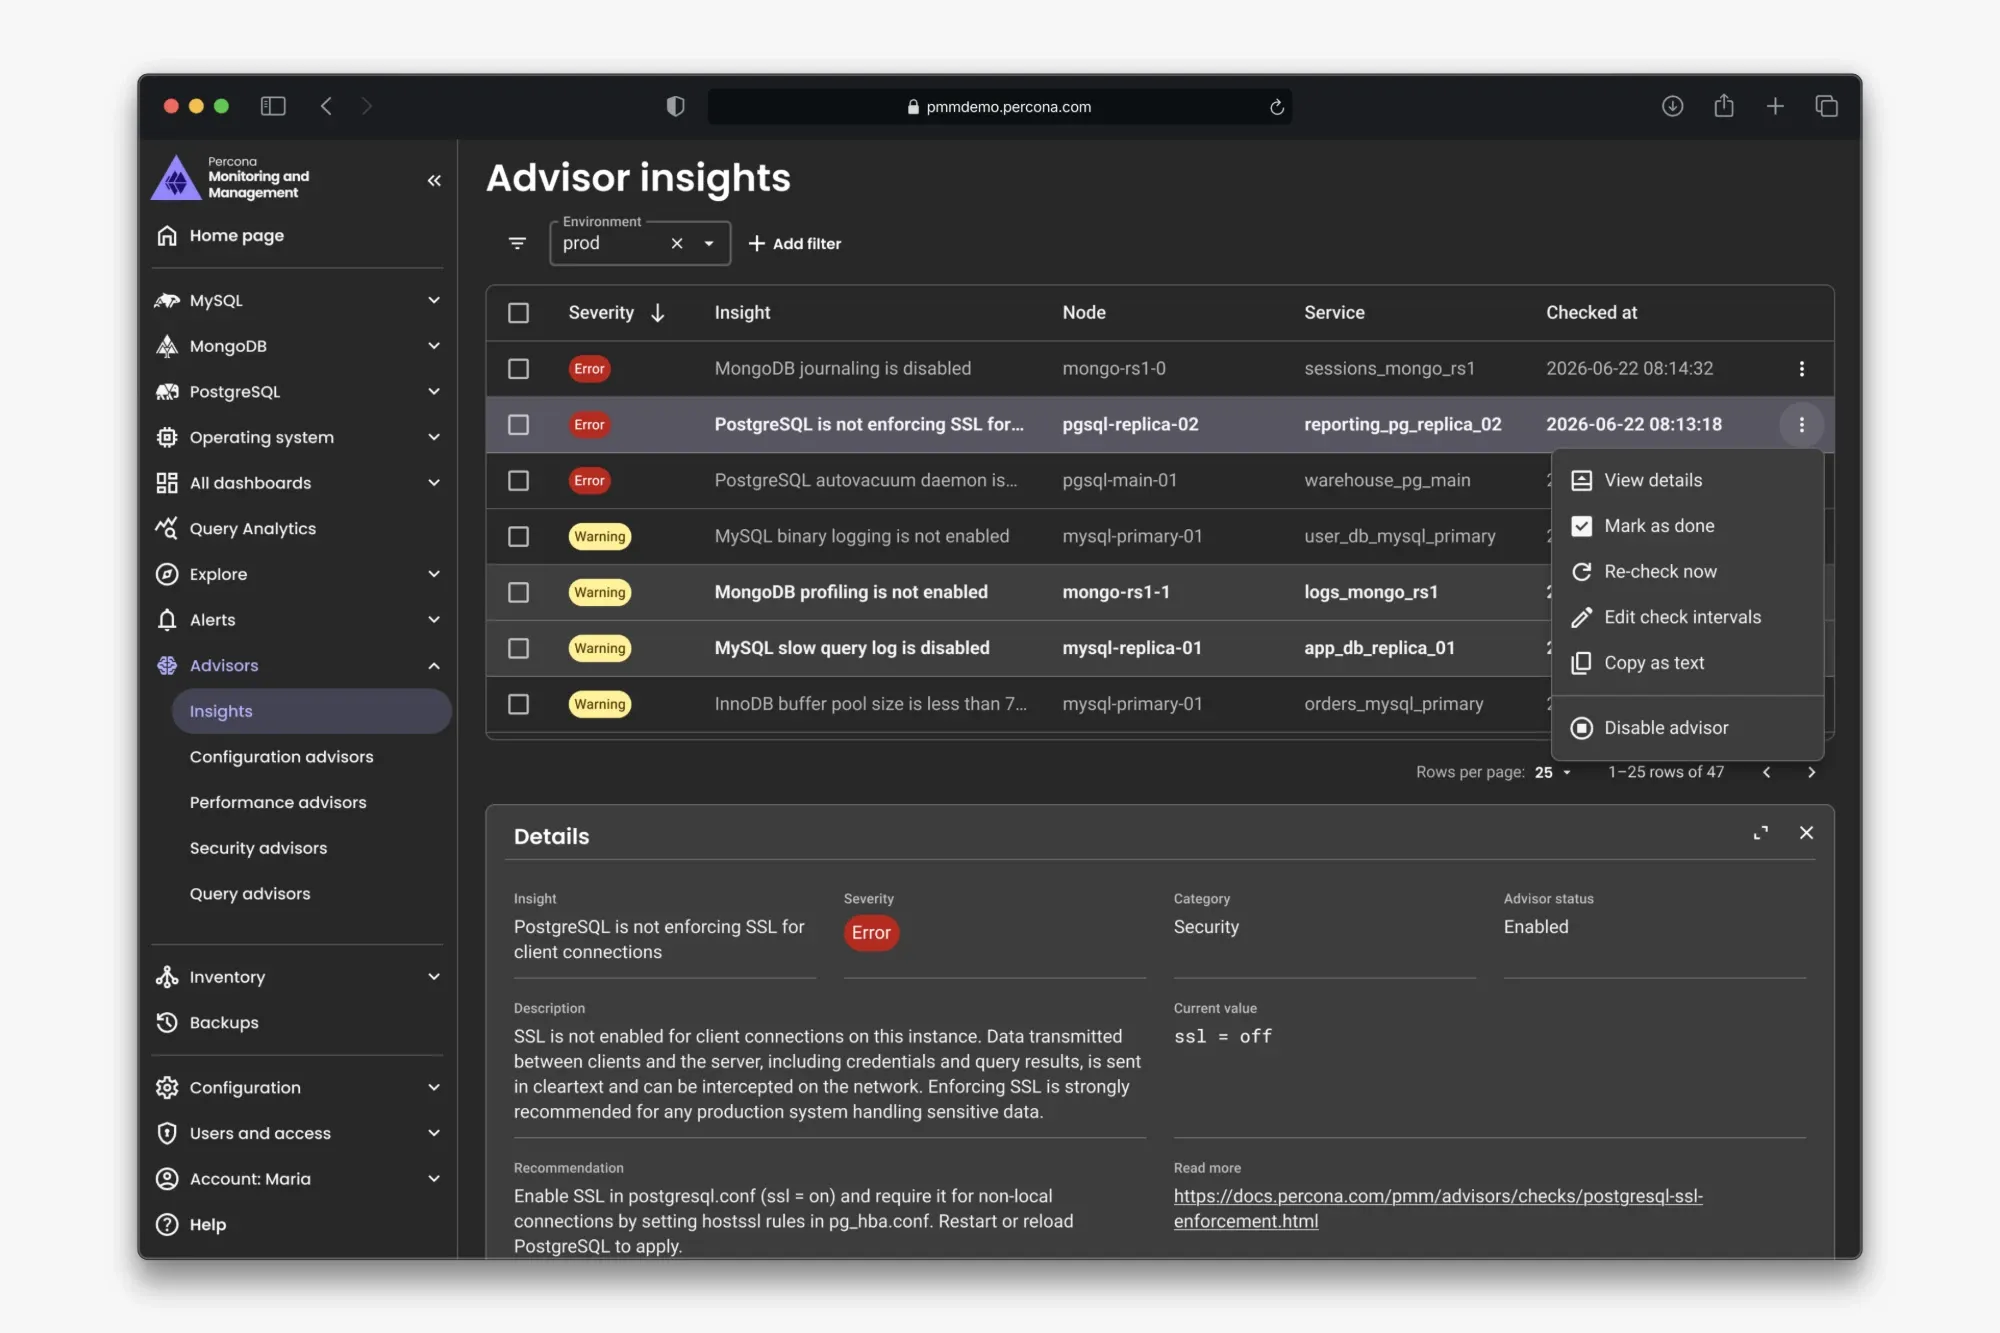
Advisors before, organized as failure counts per service, and the approved redesign prototype, organized around actionable findings.
Looking back
The strongest part of this project was translating technical knowledge into decisions about selection, refresh, inspection and session control.
I would use recognizable investigation scenarios with customers again. They helped turn an abstract product direction into discussions about concrete needs and constraints. With AI, they’re also cheaper to produce, and they give the team the drive and ambition to aim for something better, further ahead.
I would bring a wider range of everyday DBAs into shorter task-based tests more often. Internal experts and enterprise customers gave us depth, but the work also needed regular checks of how people could complete the interaction without guidance. I would also agree on how to measure the investigation workflow after release.