Peak Systems at Percona
I led the UX direction for PMM’s move beyond Grafana’s interface and helped build Peak UI, the design system that supported it.
At a glance
Problem: PMM’s interface inherited Grafana’s navigation and constraints. Users struggled to distinguish the two products, PMM features were difficult to surface, and Grafana upgrades required weeks of reworking customizations.
My role: As the only designer, I proposed the product direction and worked across research, information architecture, interaction design, coded prototypes, component documentation, UX reviews and front-end fixes. I worked with one front-end engineer initially, and later three, who owned the software architecture and implementation of the tech stack.
The outcome: PMM 3.6 shipped with its own interface for the first time. Grafana upgrade work fell from 2–3 weeks to 1–2 days. Two teams outside PMM built on this new foundation, bringing six preview apps into PMM 3.10.
A monitoring product inside a dashboard tool
PMM (Percona Monitoring and Management) helps DBAs (database administrators), SREs (site reliability engineers) and developers monitor databases and investigate problems.
Grafana provided its dashboards, but PMM had grown to include query analytics, backups, inventory, advisors and other workflows. Its interface still exposed the structure of the underlying components, making PMM’s own capabilities harder to understand. It was not uncommon to find a customer surprised that feature X existed until we mentioned it directly.
That dependency also affected delivery. Every Grafana upgrade, often prompted by a security fix, meant rebuilding our customizations. The work took 2–3 weeks, and PMM’s experience remained tied to decisions made for Grafana’s users.
We needed control over PMM’s navigation and interface while retaining the Grafana capabilities the product depended on.
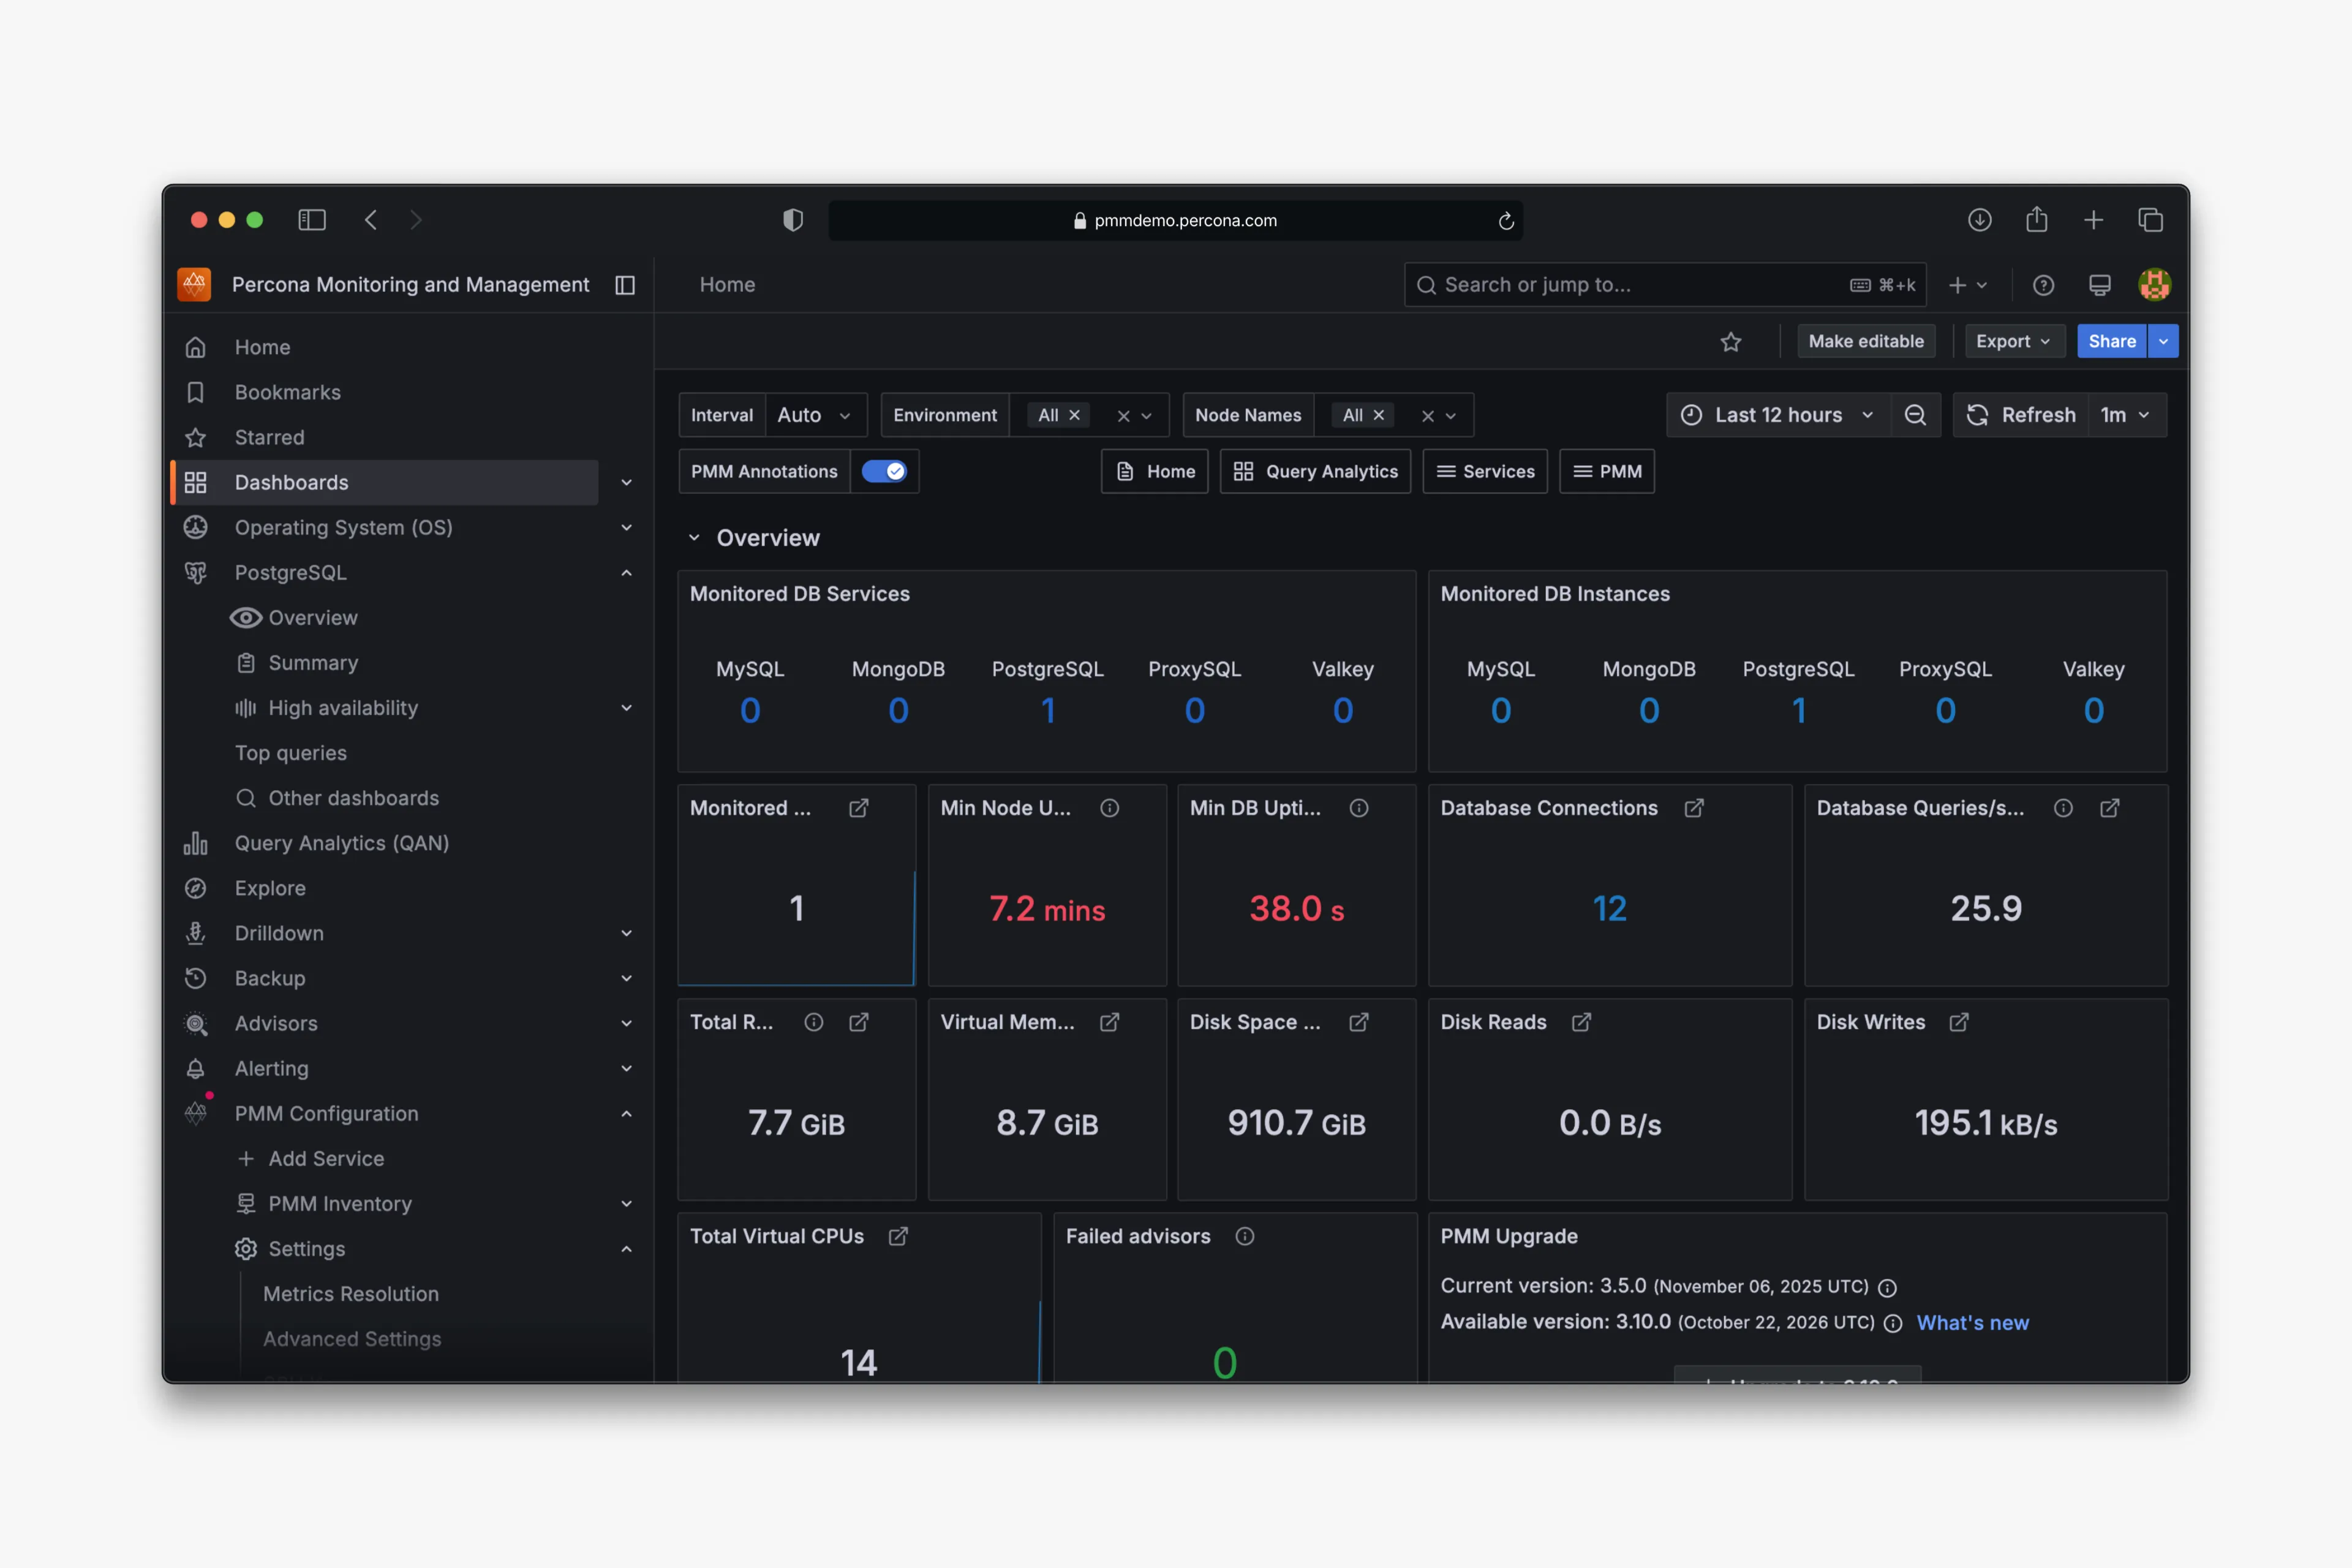
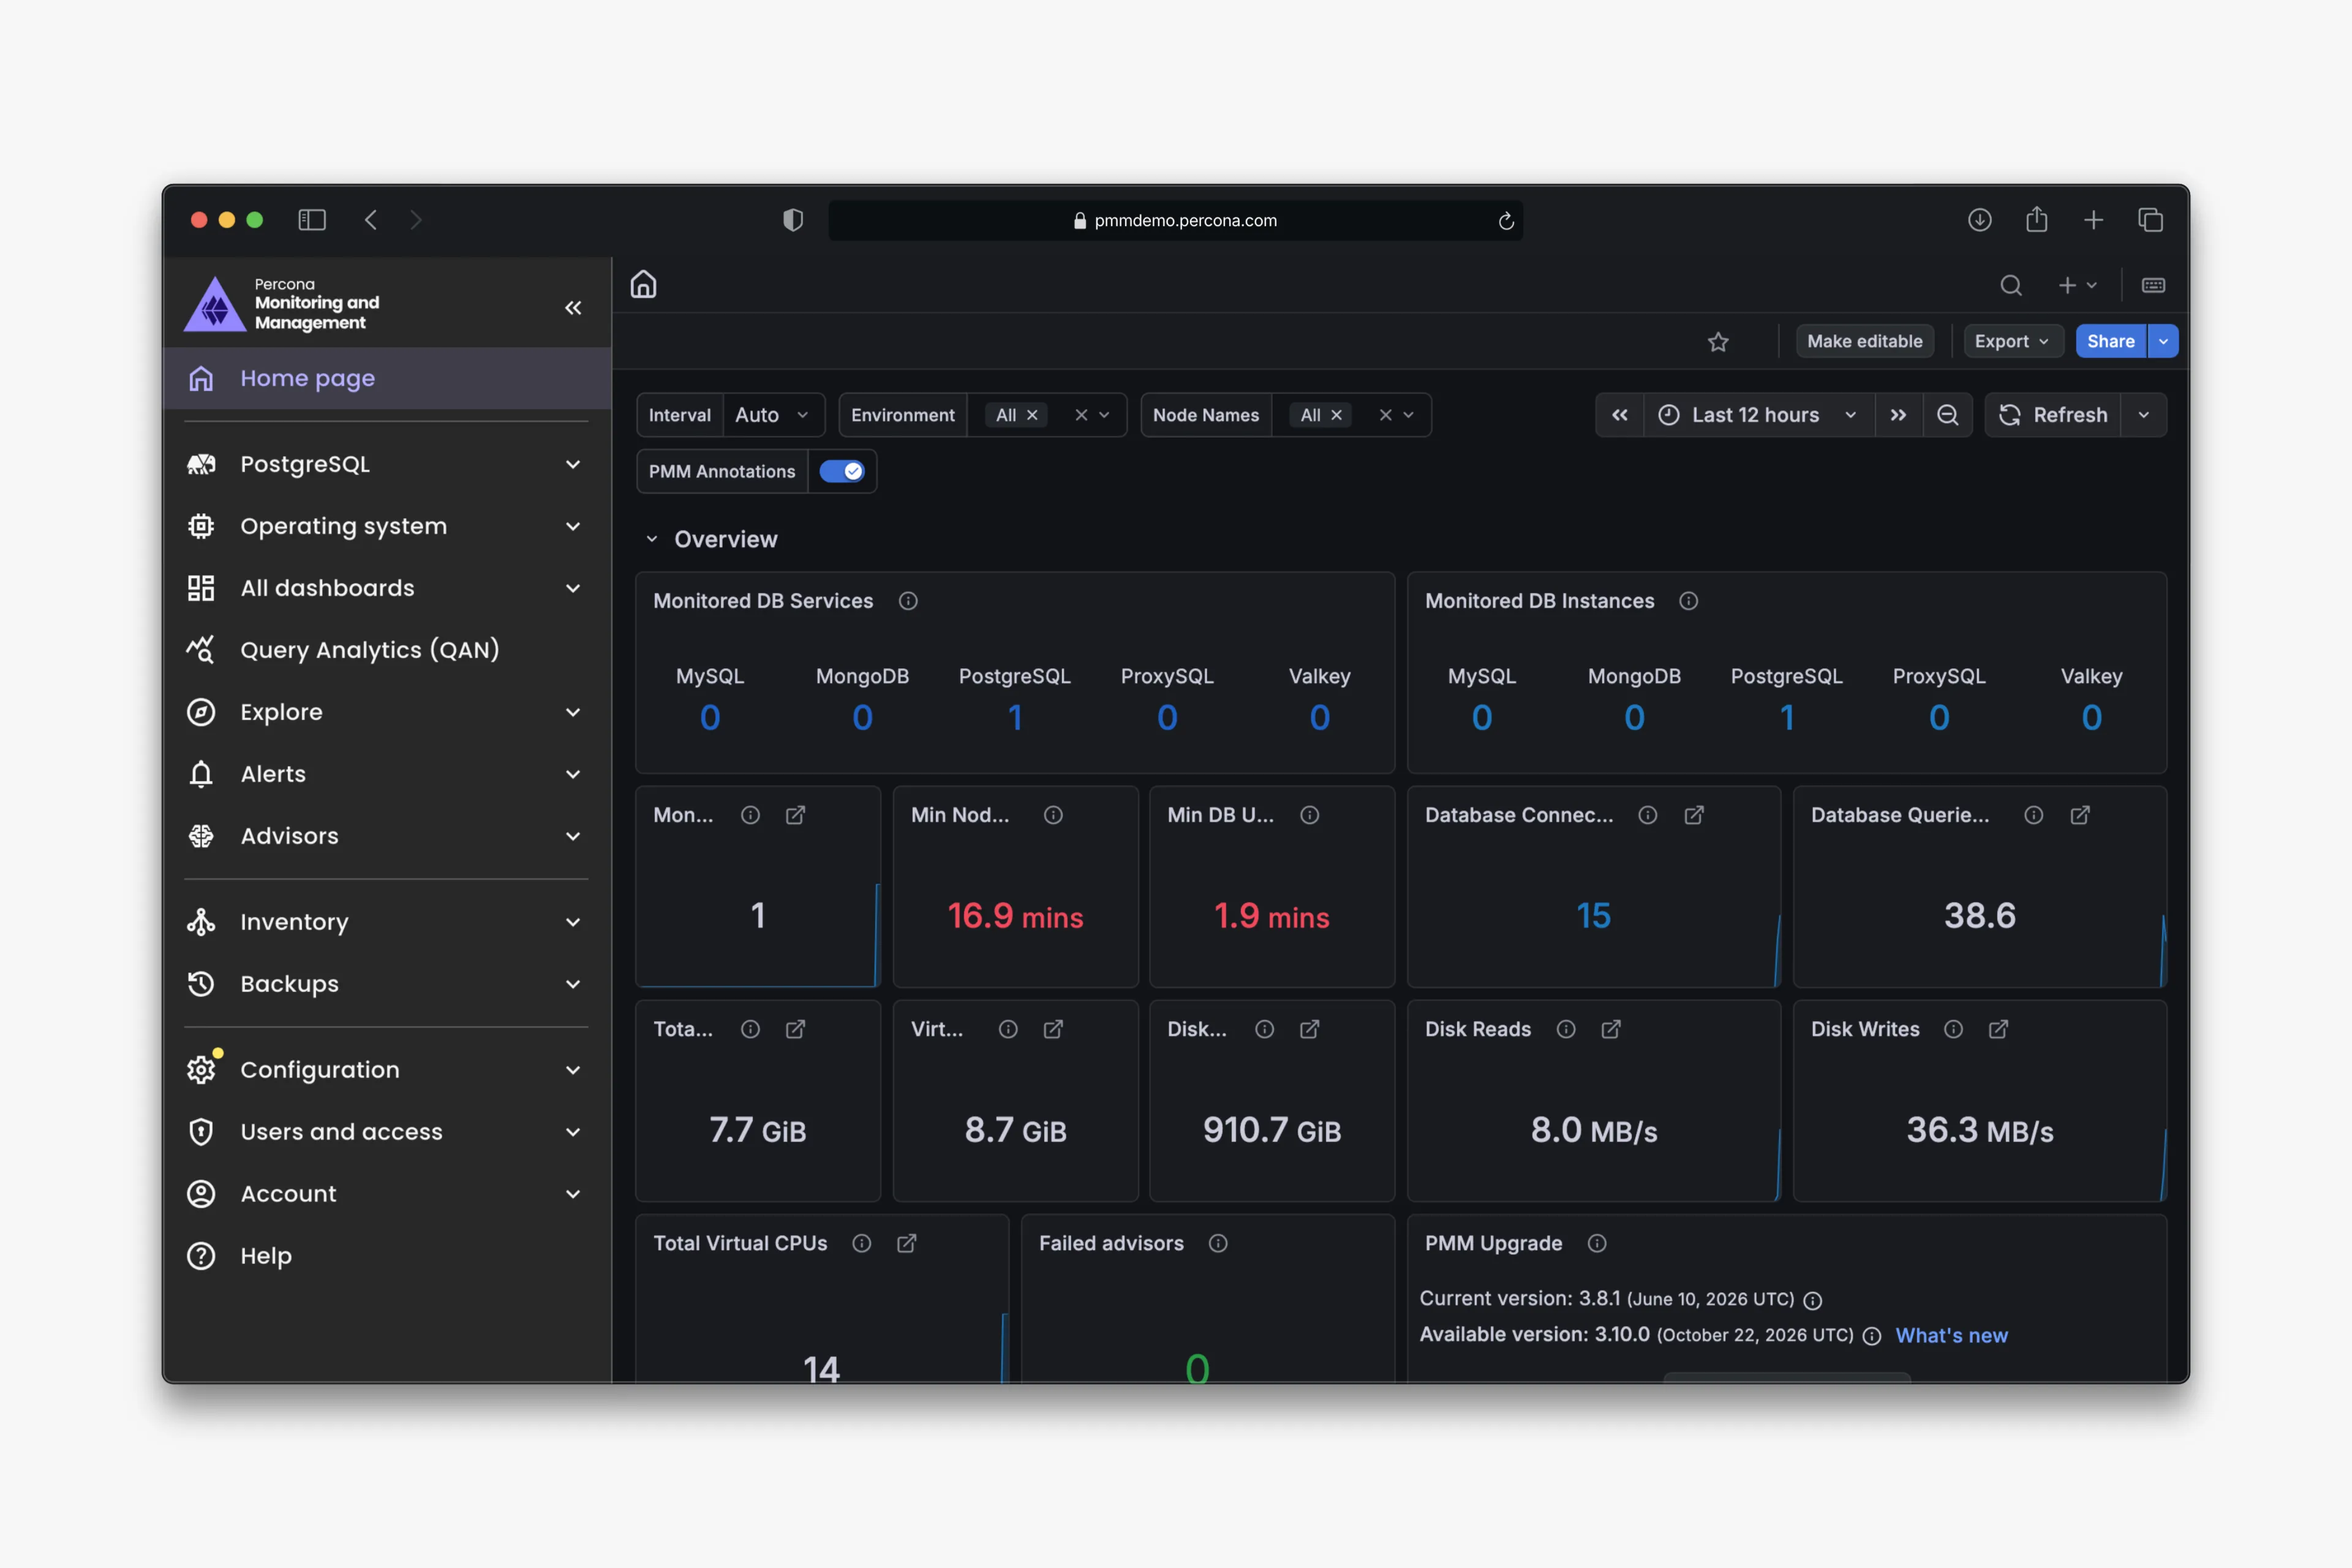
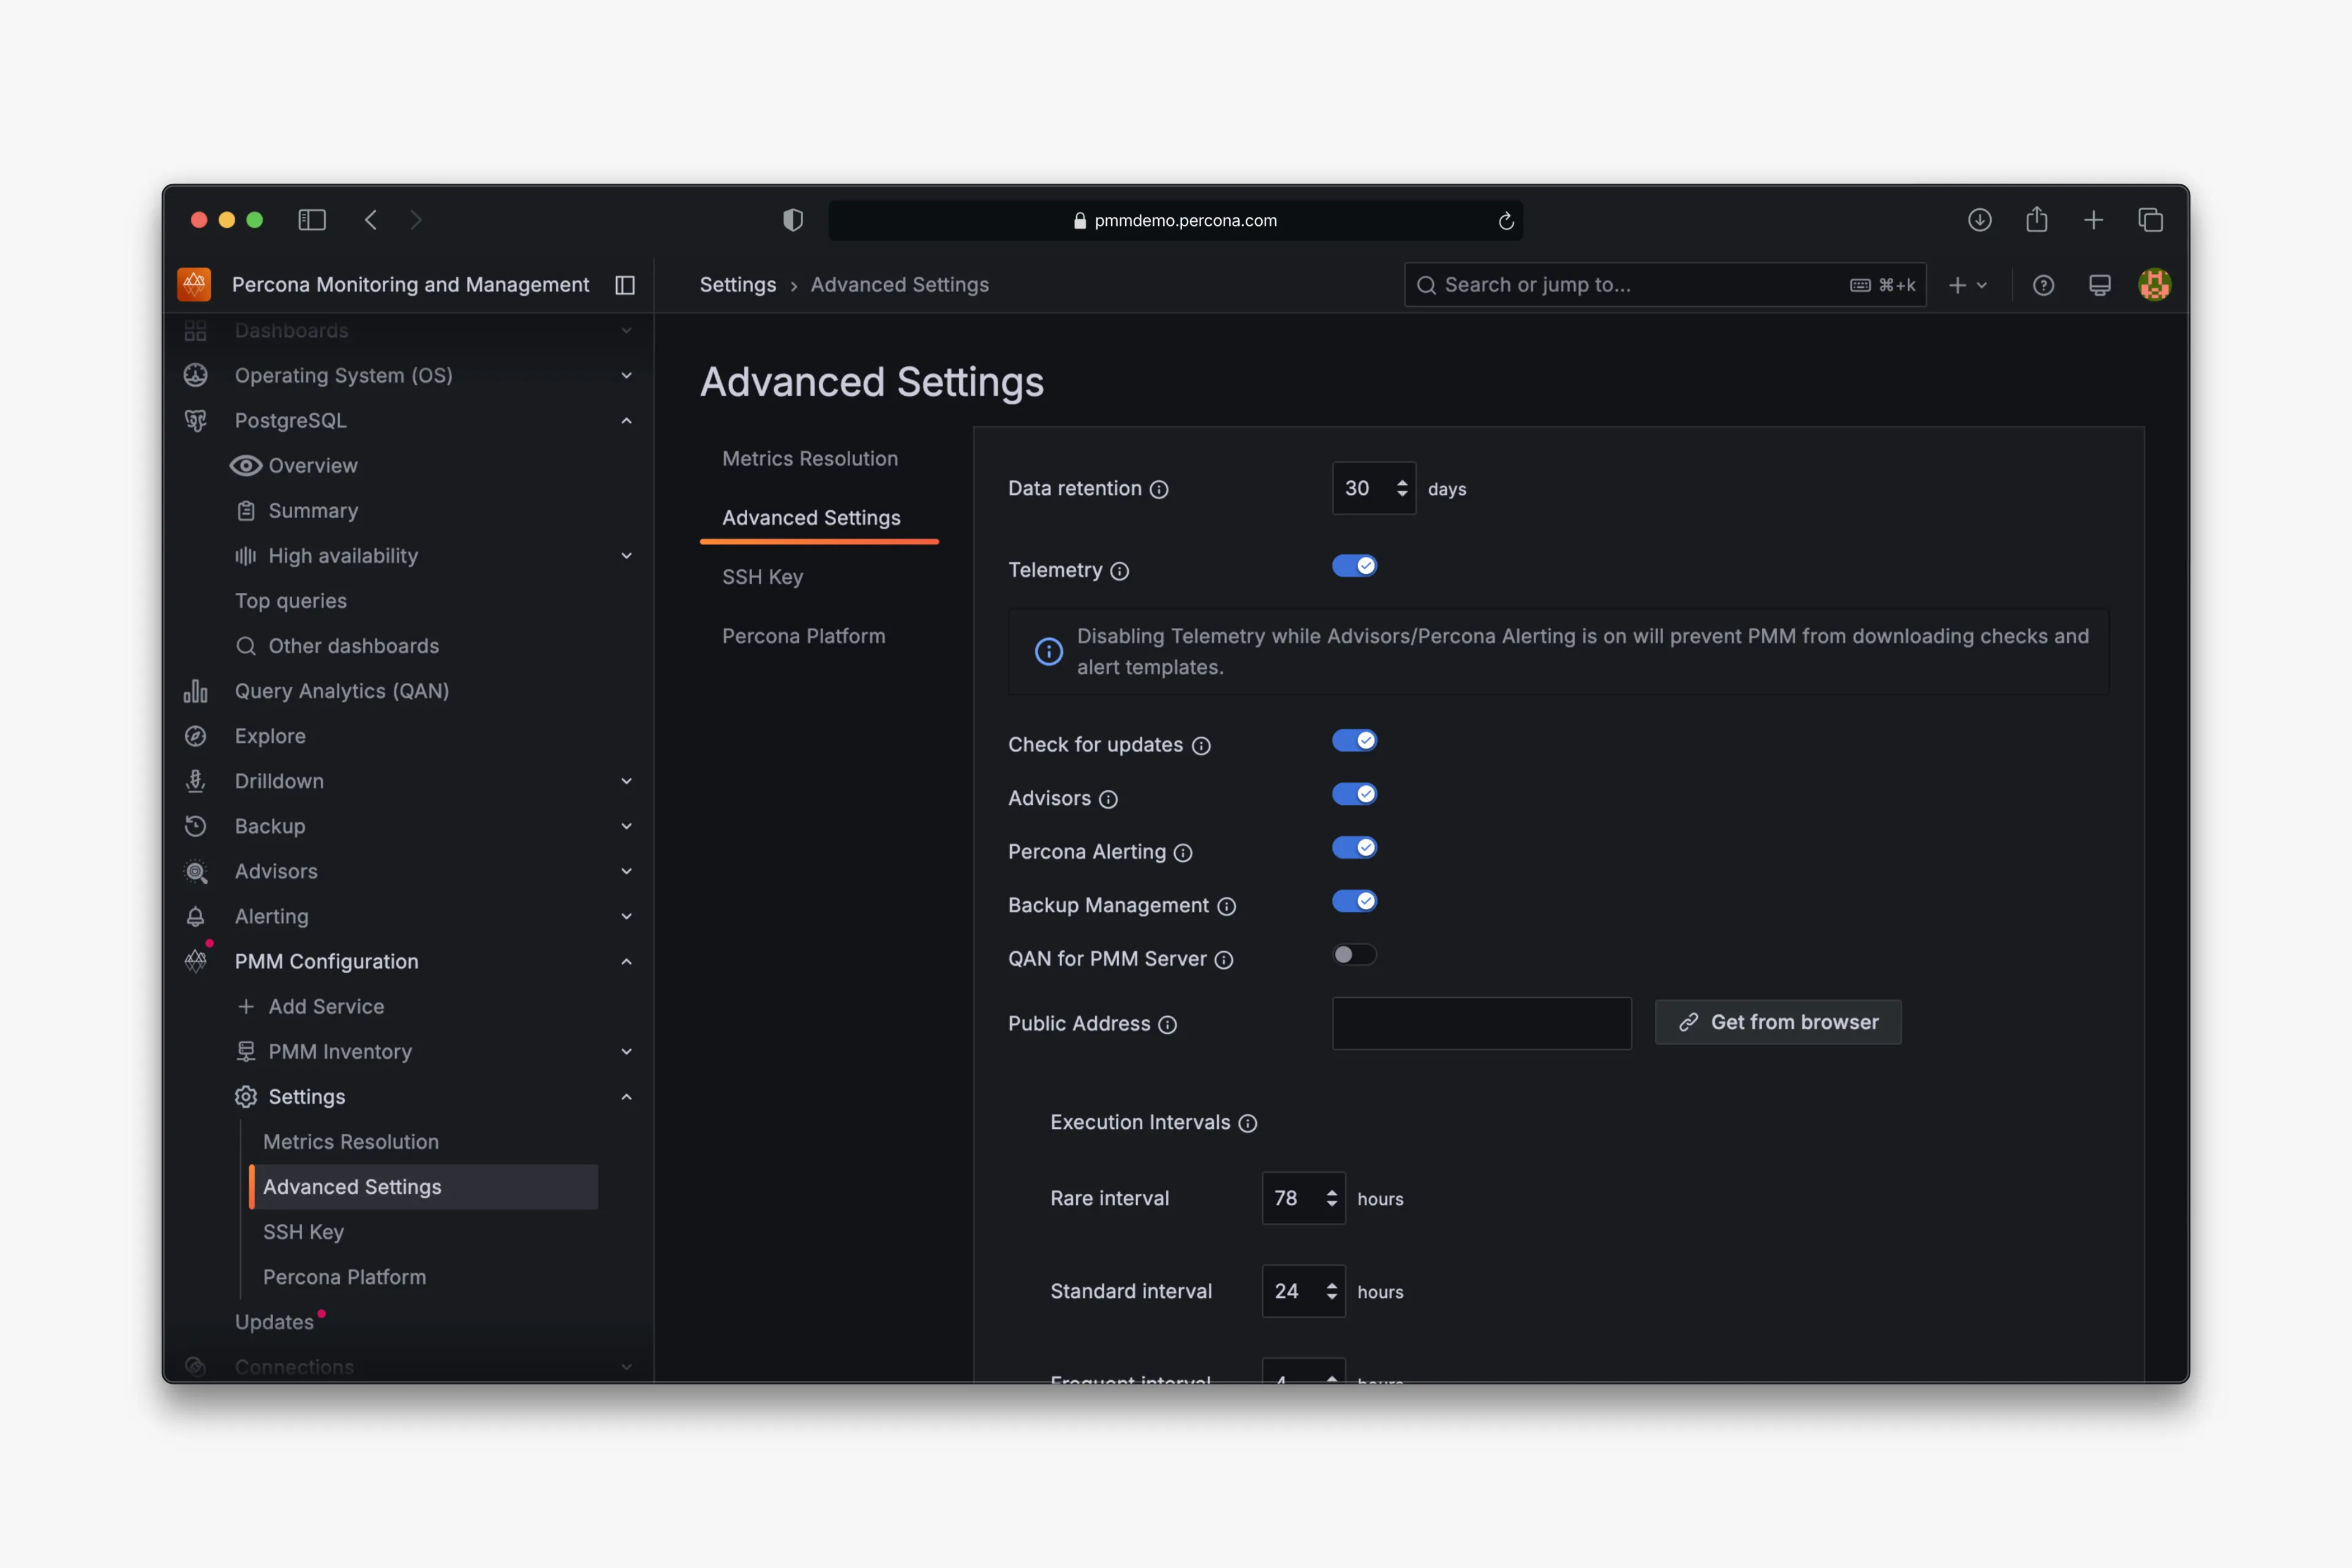
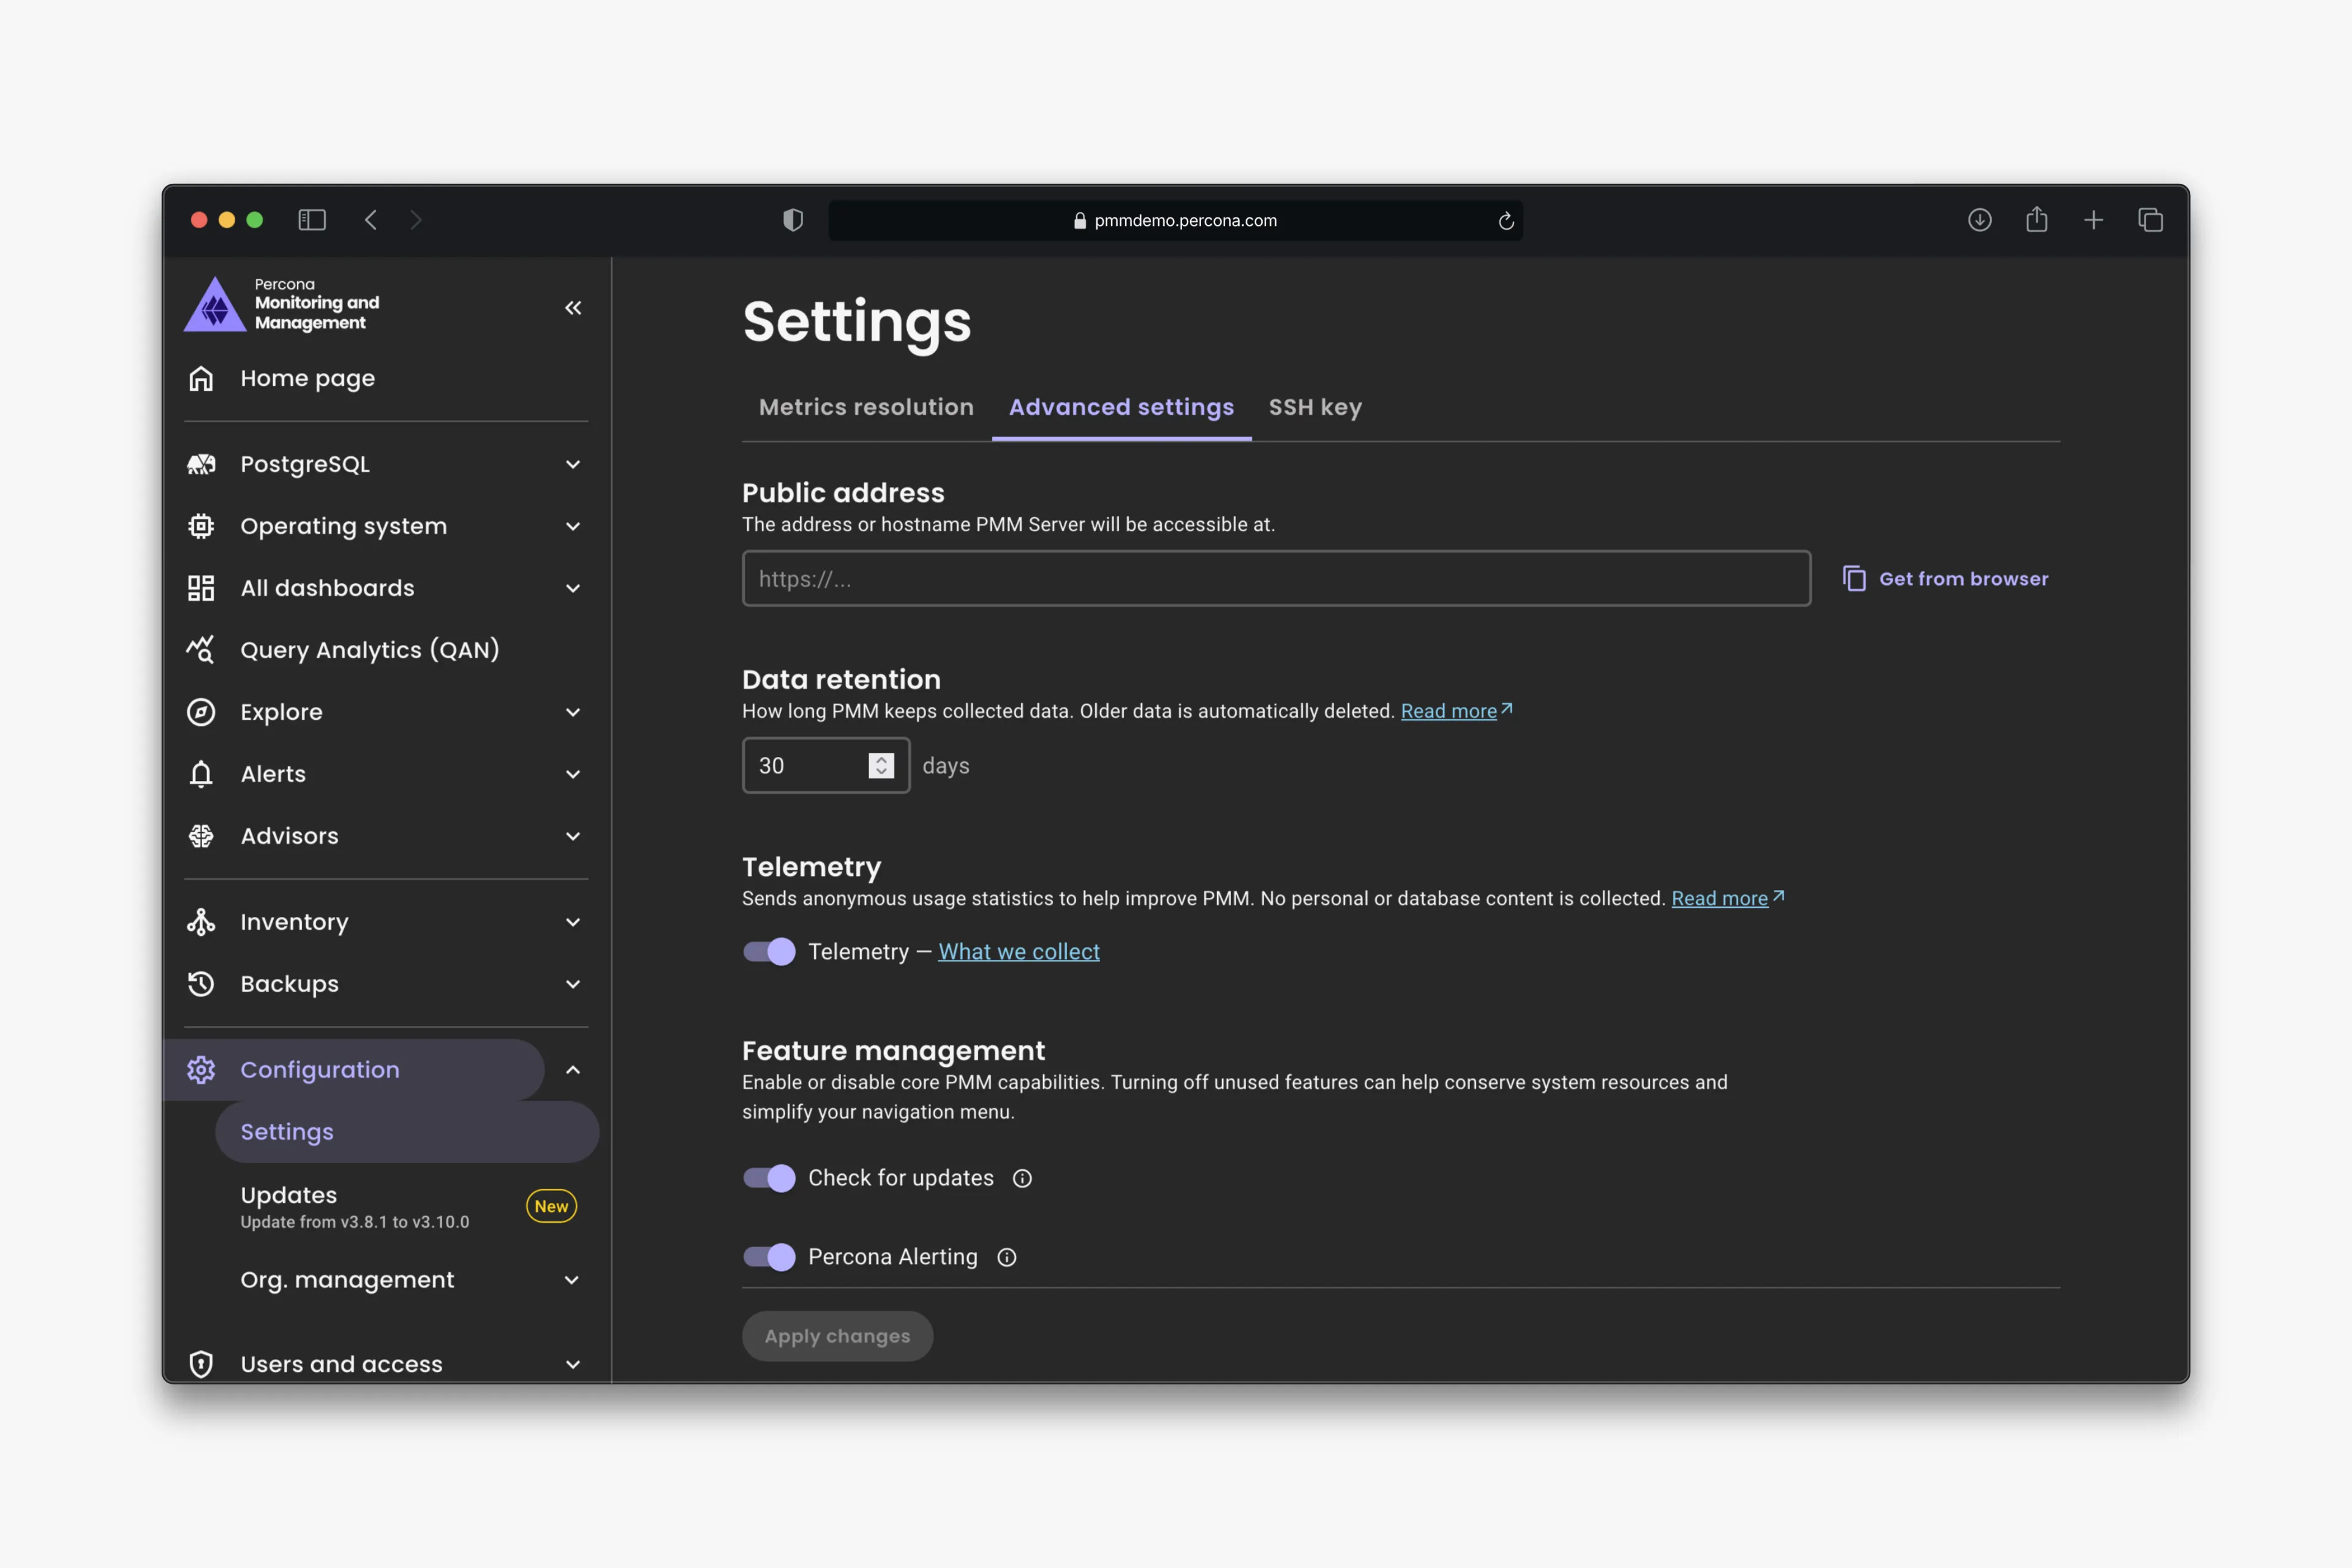
Home page before and after PMM’s native interface, followed by Settings page before and after.
One product navigation across different components
In 2024, I proposed “Reclaim PMM”: a native interface with Grafana contained underneath it, exposing its capabilities through APIs where possible.
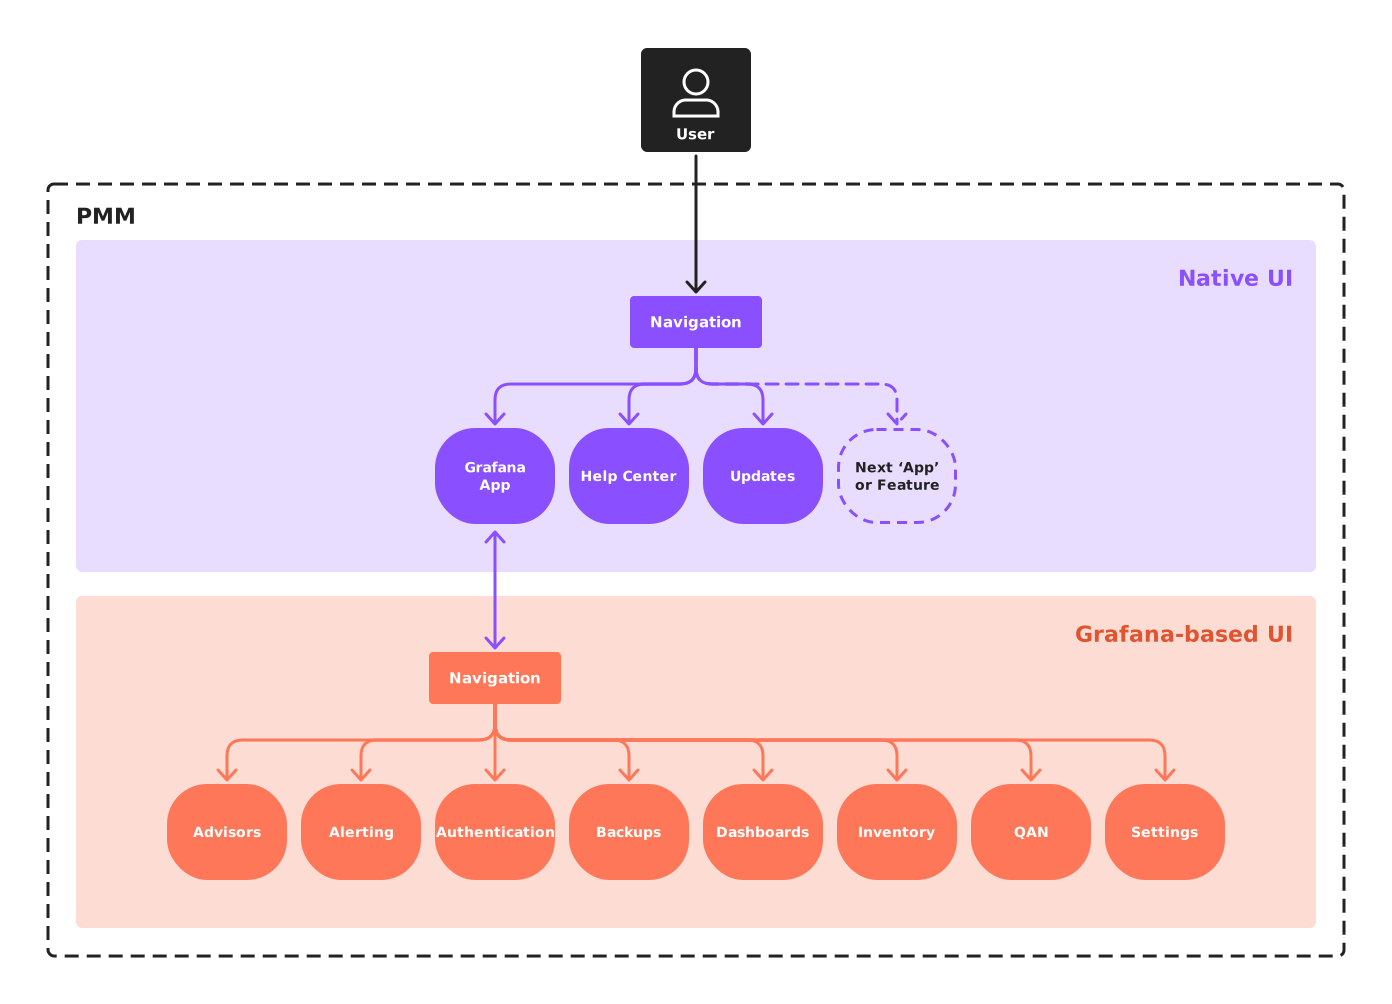
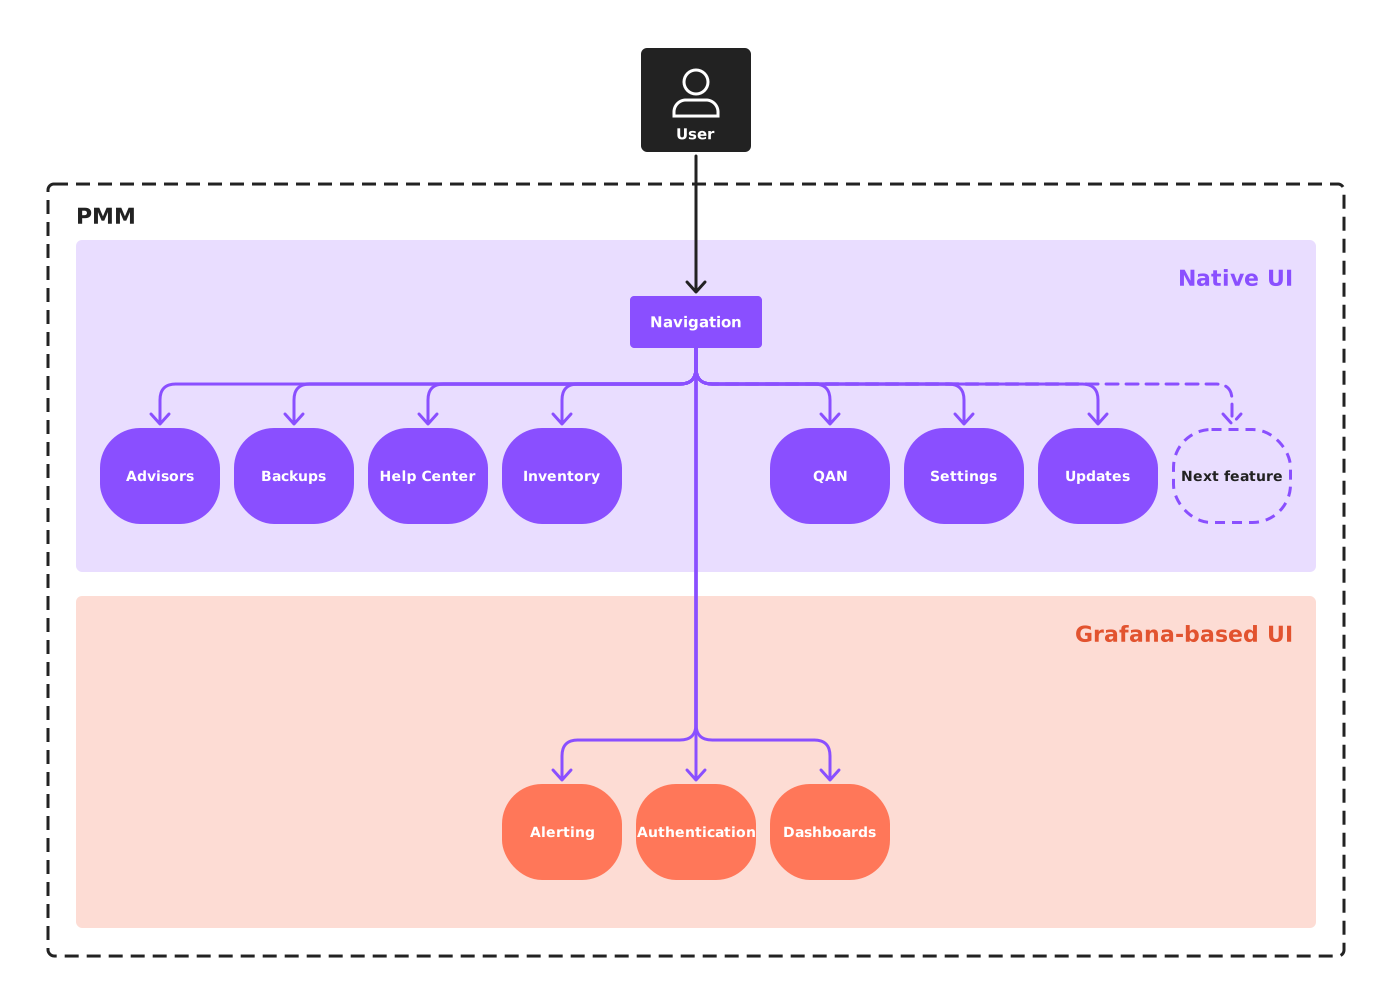
There were two approaches. The engineering team initially favored making Grafana a separate app inside PMM because it looked faster to deliver. I argued for a shared navigation that exposed PMM’s features directly, regardless of which component rendered them.
The distinction mattered to the user’s task. Finding alerting or dashboards should not require understanding which software component provides them.
Two approaches: Grafana as a separate app with its own navigation, and the alternative, PMM’s features accessible through one shared navigation, regardless of the underlying component.
Interviews with six senior DBAs and SREs who had never used PMM highlighted information overload (“too many widgets, too many boxes, too many numbers”) and fatigue from switching contexts, so I used those findings to argue for a more coherent experience across the product.
I developed the direction into a clickable Figma prototype. It showed PMM’s own navigation opening dashboards, Query Analytics and Explore within the same interface, and helped secure leadership and stakeholder support.
Build the foundation through real releases
Peak UI began as a Figma library supporting the vision and prototypes. It later became a React design system, developed with the front-end engineers and used in PMM and other internal Percona products.
We introduced that foundation incrementally:
- PMM 3.0 (January 2025): the server and client update experience became the first PMM workflow built on Peak UI.
- PMM 3.6: PMM’s native interface and navigation shipped.
- PMM 3.8: Settings was rebuilt as a native Peak UI page.
The update workflow gave the components and architecture a production use before the wider interface depended on them. Users could update the PMM server, then identify which clients — the software installed alongside databases — still needed updating.
For the native navigation, I shared prototypes and gathered critique asynchronously, giving people space to question the direction. Alongside the engineers, I worked through interaction details and front-end fixes covering behavior, animation, alignment and accessibility.
We also brought the Settings page (shown above) and a consolidated Help Center page into the native interface, replacing help content scattered across Grafana customizations.
Keep design intent available in code
As Peak UI grew, I kept design intent in Storybook and the component documentation so teams could use it during implementation.
For example, the Empty State documentation explains what a title should communicate, how the description should explain the absence of content, and when to use each size. Those decisions sit alongside the component’s props and examples.
Components also carry maturity tags: Stable, Beta, To review and Deprecated. These make their readiness visible to teams choosing what to build on.
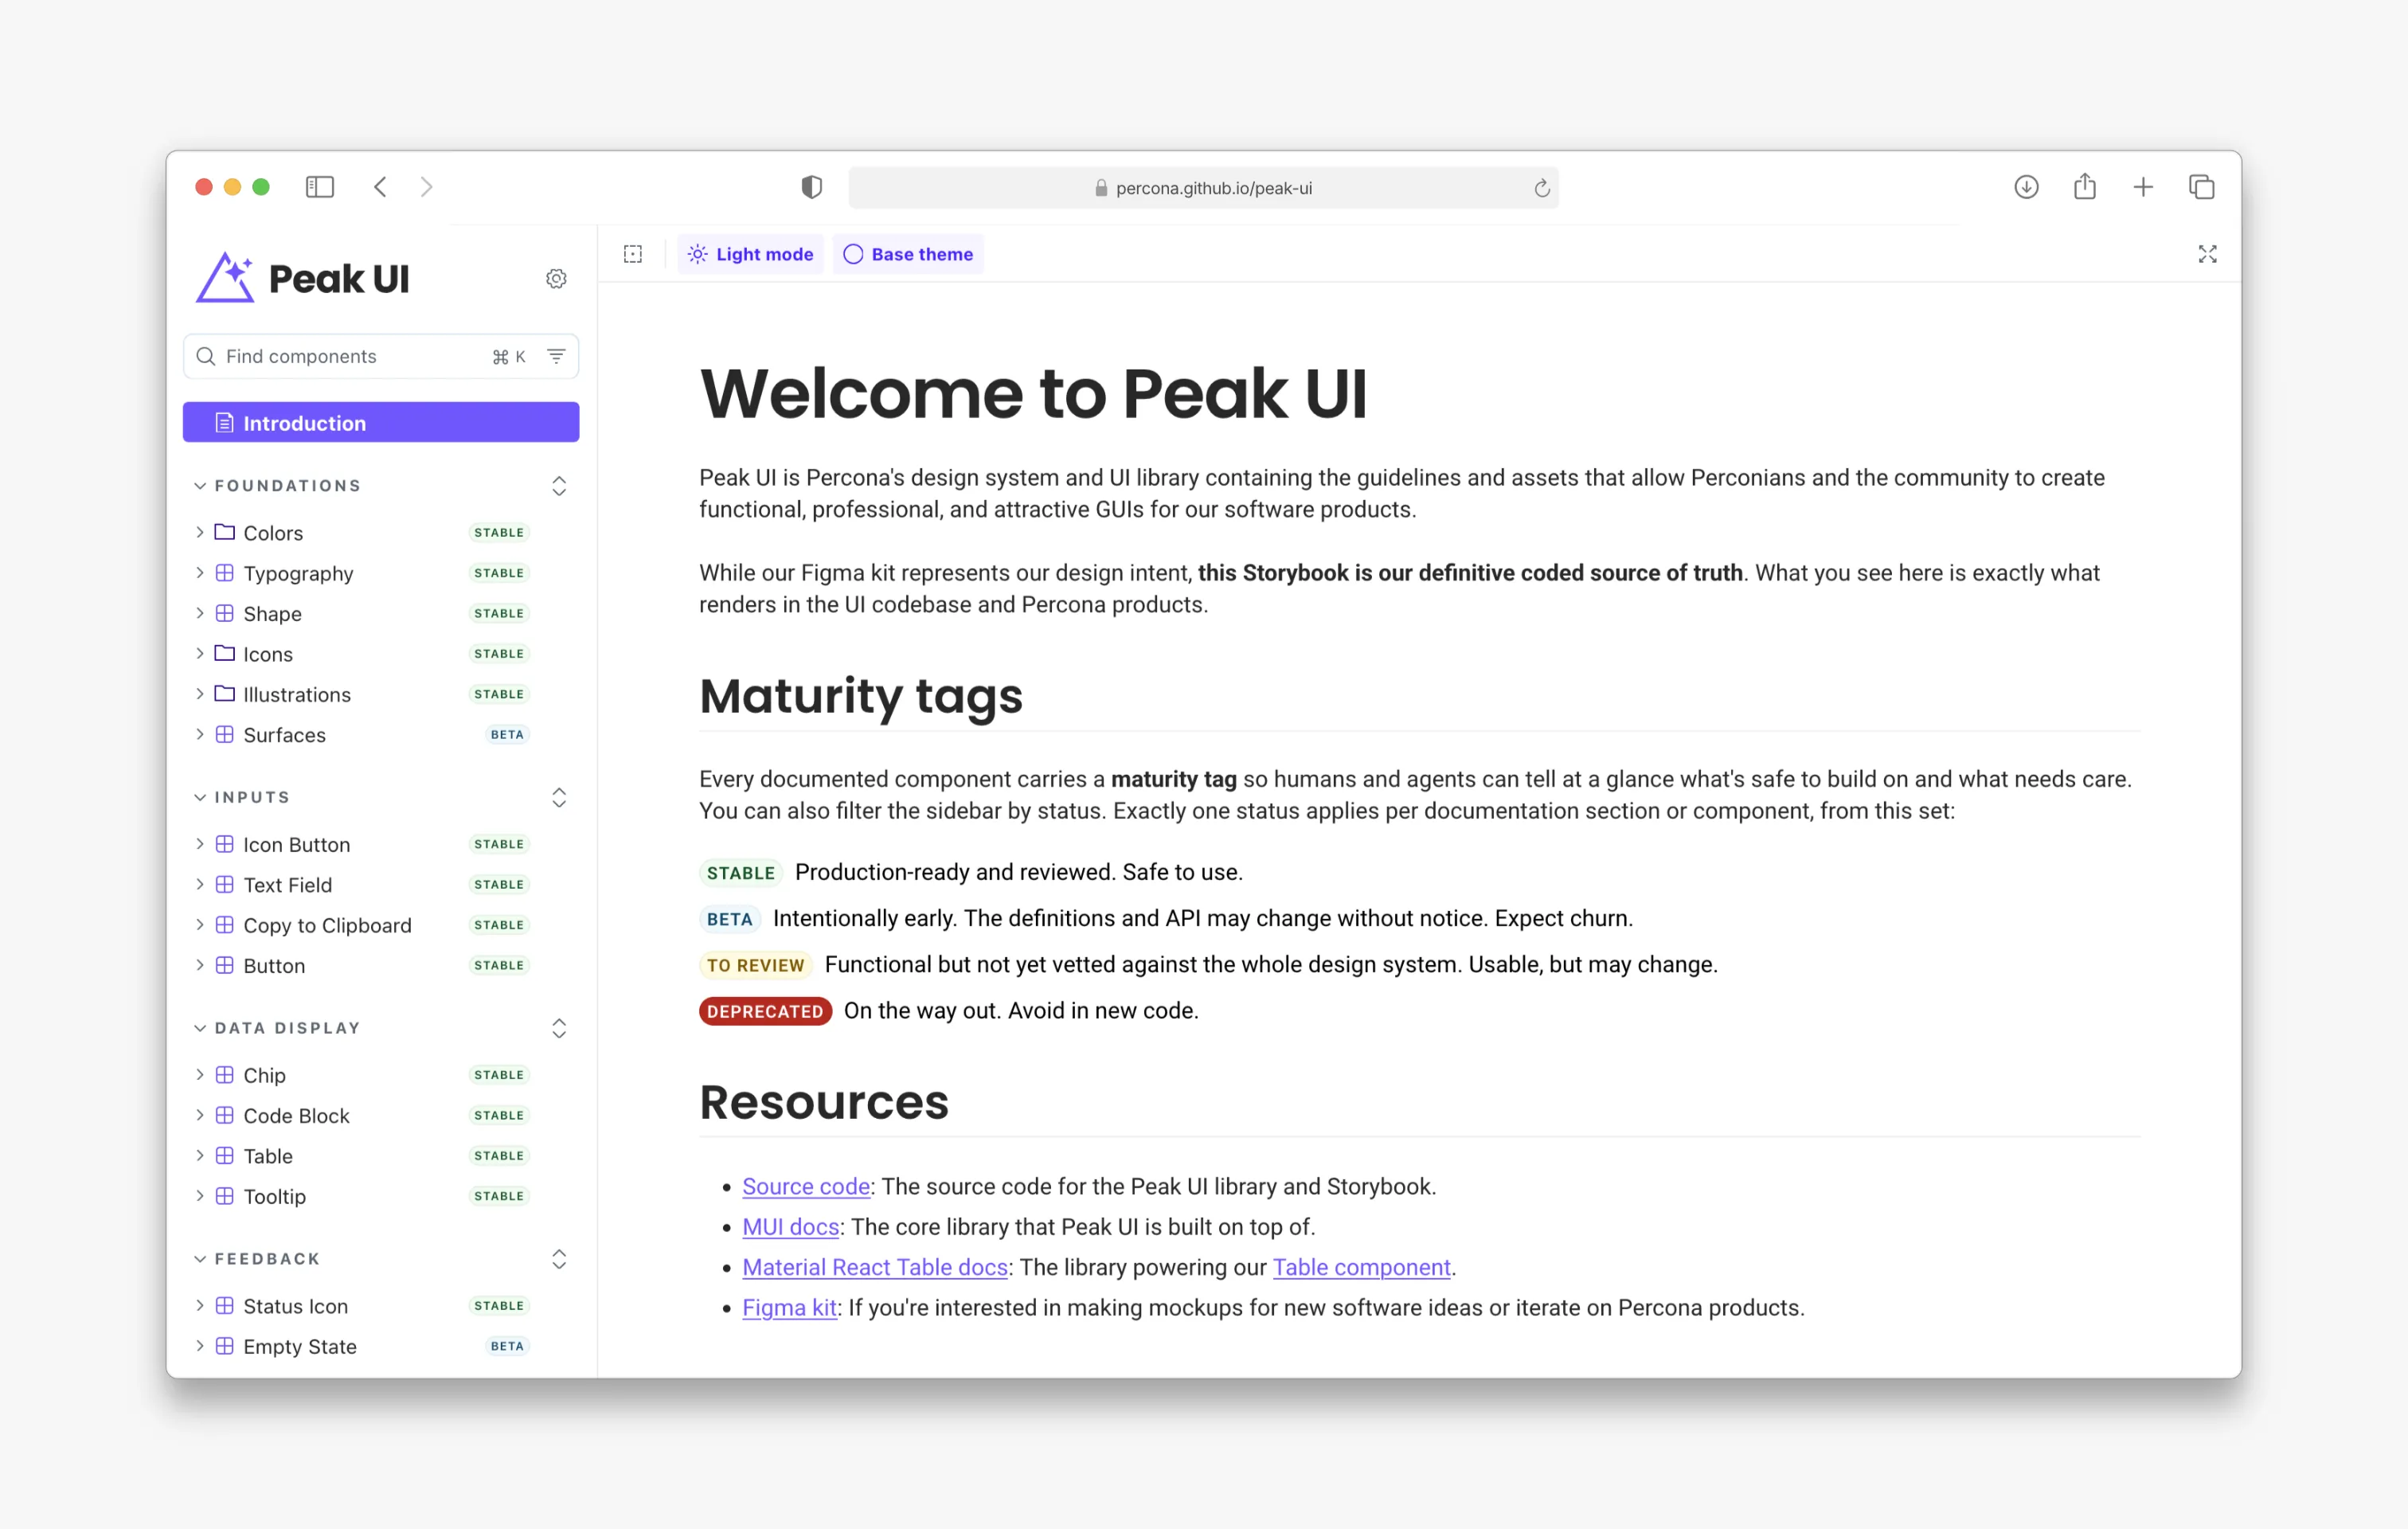
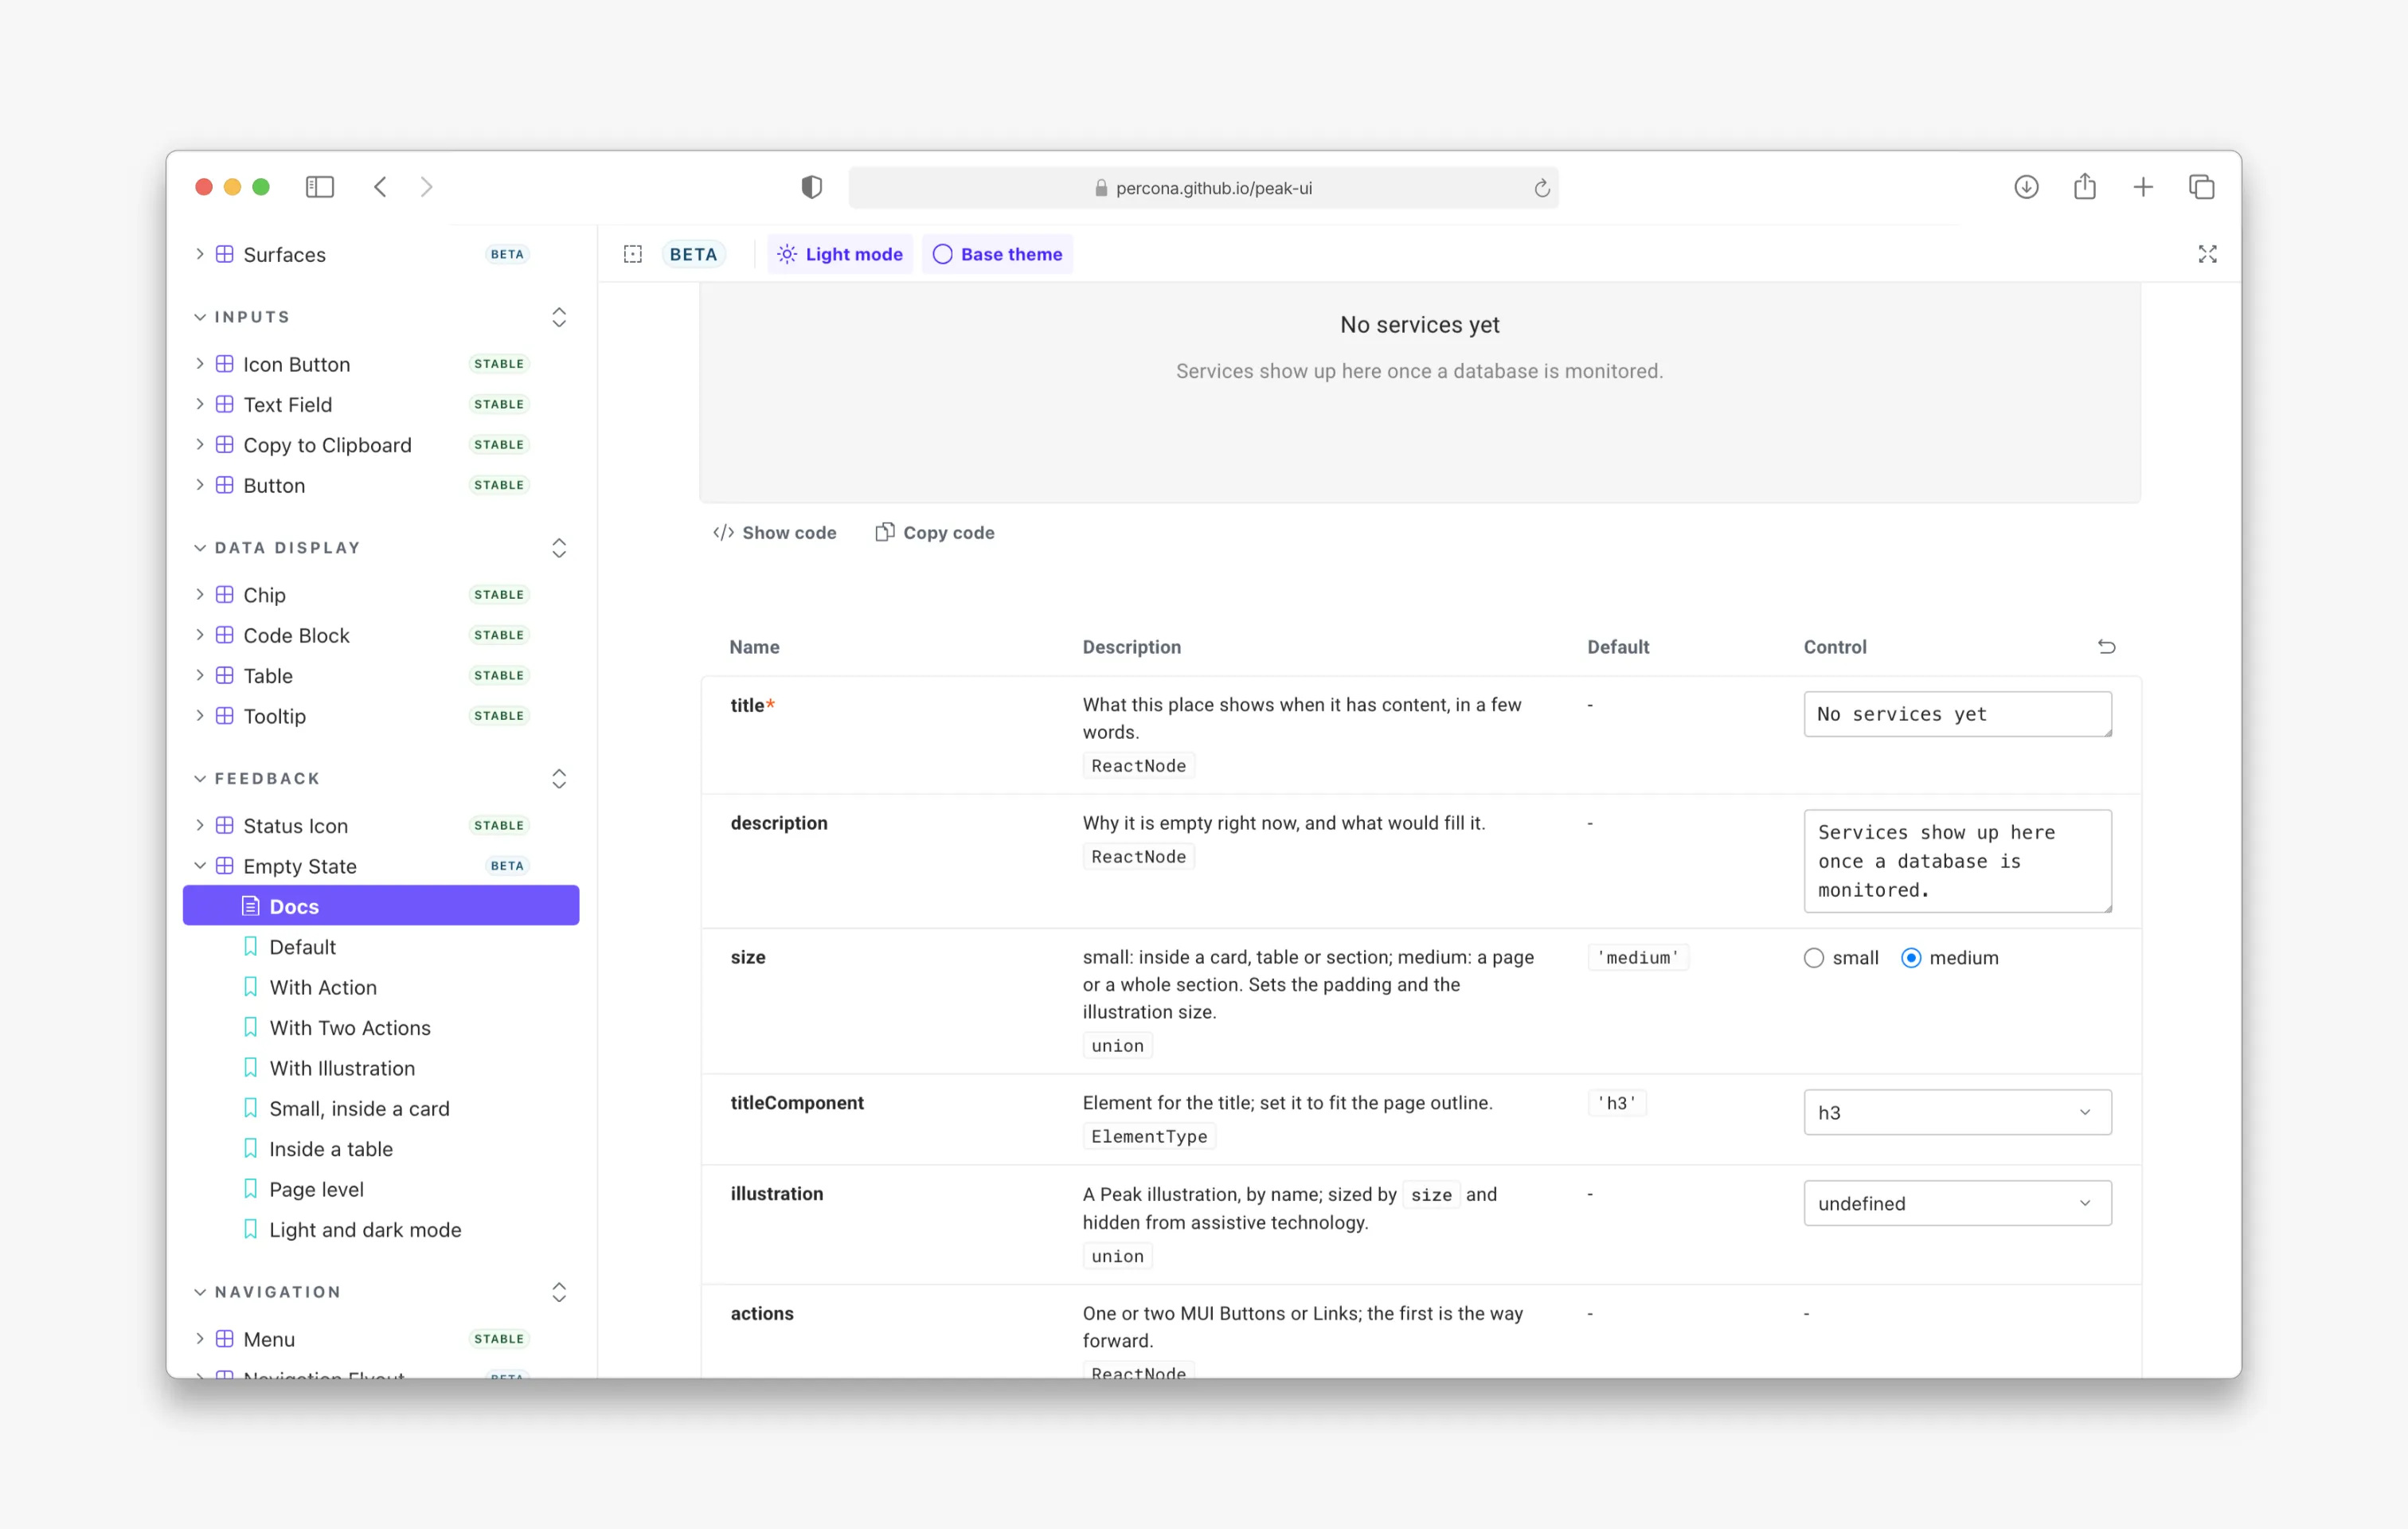
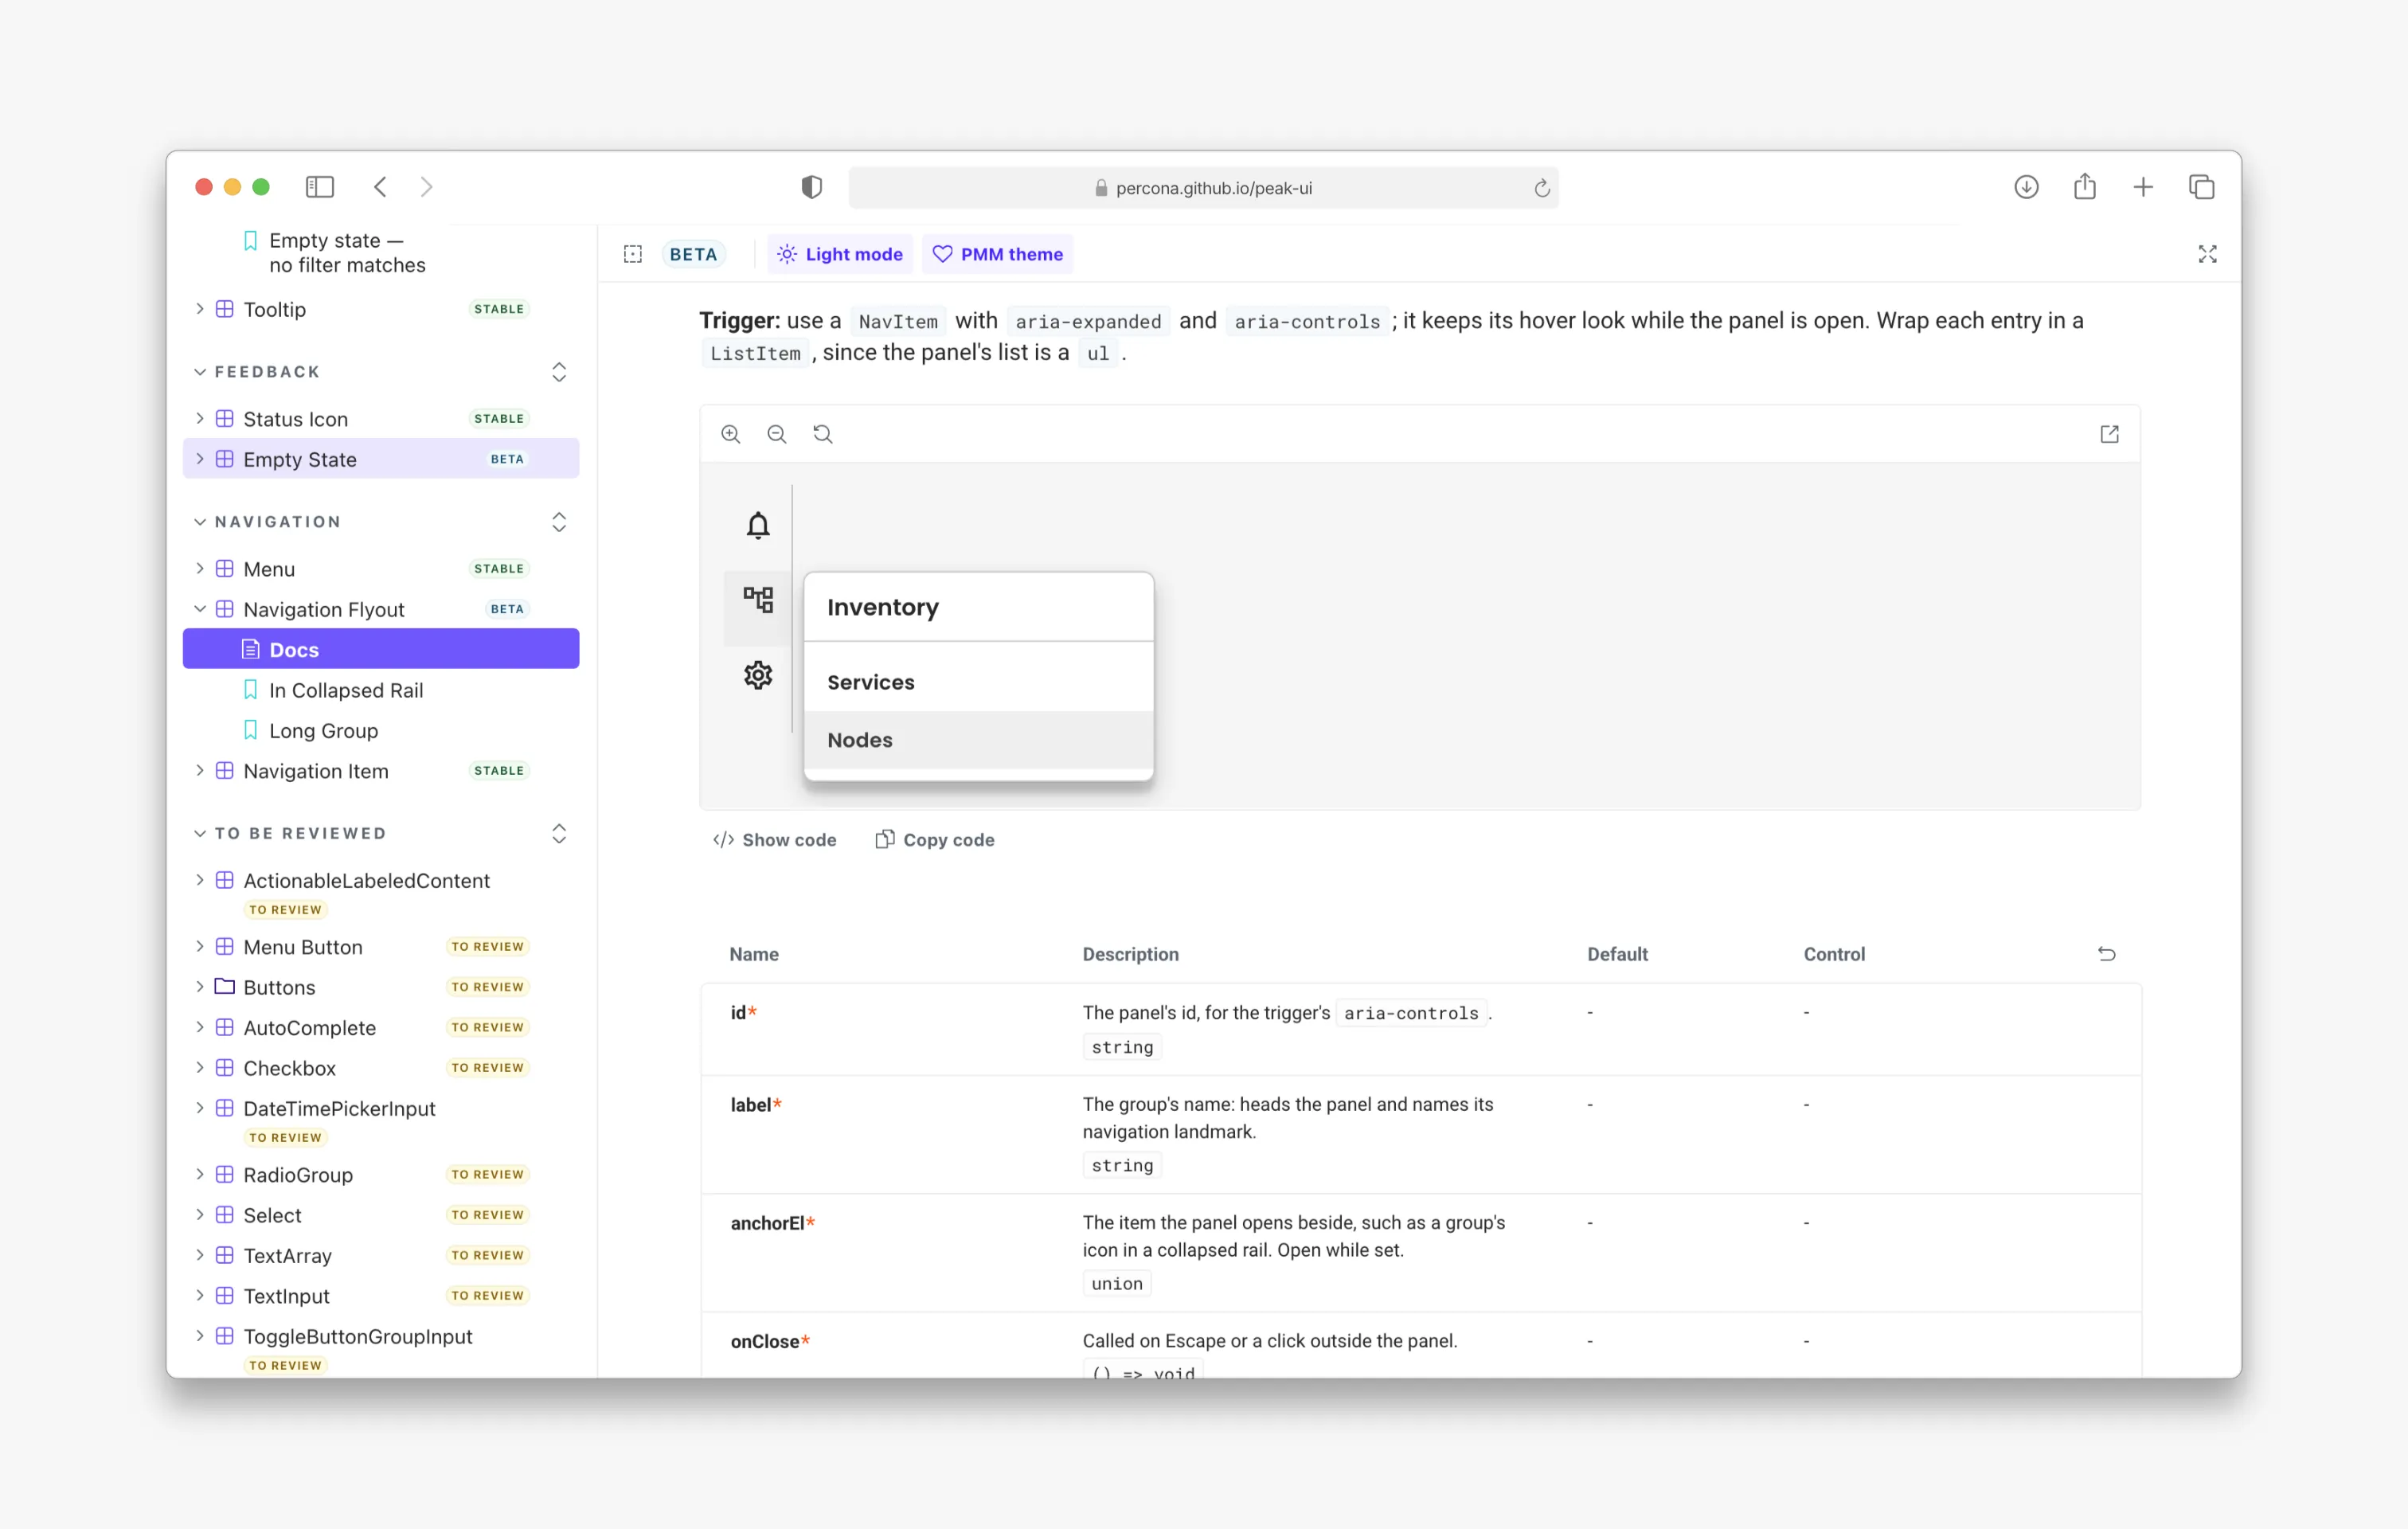
First, component maturity tags; then Empty State guidance; and finally Navigation Flyout documentation. Usage rules sit alongside component APIs to guide implementation.
This was part of my contribution between design and engineering: making interaction and content decisions available where implementation happened, then reviewing and fixing details as the product developed.
Other teams built on the foundation
The internal Services team had developed a tooling framework using Peak UI. The native interface gave that work a faster lane into PMM, where it was branded as Extensions and contributed two preview apps in PMM 3.10. The MongoDB team contributed four more.
This was a concrete sign of adoption: two additional teams could build applications inside the product using the shared foundation, with the plasticity to deliver their software through UI.
My work extended to reviewing those experiences. For Operations for MongoDB, I reviewed every screen and deliberately broke a running replica set to inspect the failure states. I then documented the critical UX issues for the team to address before release.
The platform grew, but the navigation needed another step
The first native interface retained much of the pre-existing information architecture to avoid disorienting users or making them relearn it. By PMM 3.10, the growing list of apps exposed its limits: it couldn’t scale.
Feedback highlighted two problems: the collapsed sidebar had lost its flyout submenus, and the navigation was filling with items that were irrelevant to some users, while still being relevant to others.
The next challenge was organizing a broader product around the work people needed to do.
I proposed a flat sidebar with a hub page for each database technology and an overview page showing the current state of the environment, with drill-down paths into metrics and logs. Here, the past interviews, customer discussions and support cases that informed our four documented personas — DBA, SRE, application developer and engineering manager — came in handy to check the architecture against different needs.
Test the structure and expose the weak points
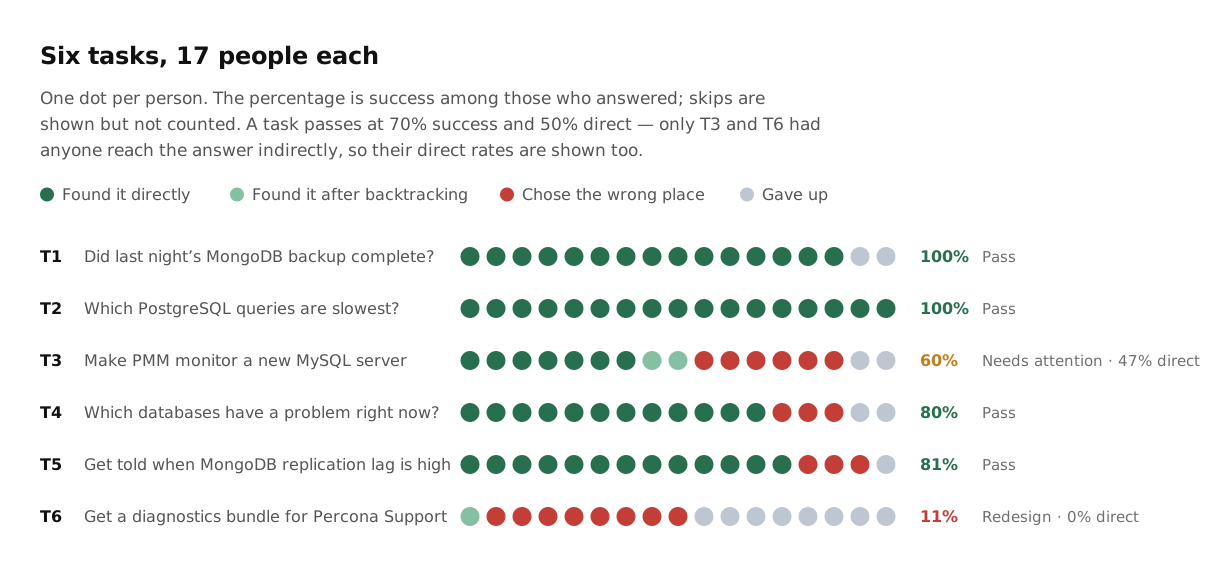
I tested the proposed architecture with 17 people using a tree-testing tool I built. Four of six tasks met the success and directness criteria I had set beforehand.
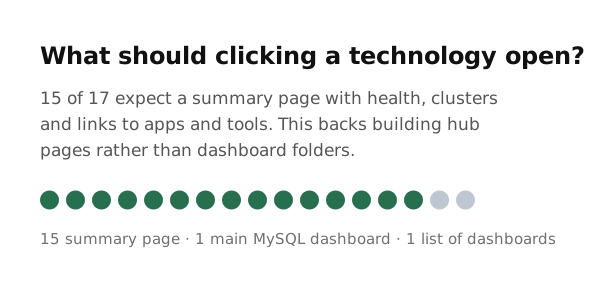
Left: six navigation tasks exposed weak paths to server setup and support diagnostics. Right: 15 of 17 participants expected a technology to open a summary page.
The test also exposed two weak points. Adding a monitored server was difficult to locate within the distinction between Nodes and Services. Finding a diagnostics bundle for Percona Support performed particularly poorly under Apps.
Those results identified placements that needed revision. Separately, 15 of 17 participants expected clicking a database technology to open a summary page, supporting the direction of technology hubs.
The test gave us evidence about the proposed structure and specific problems to address before implementation.
Turn the proposal into smaller deliveries
The tree test took place while the sidebar was already shipping. To save engineering time, the team released it with the existing information architecture.
I worked within that decision and split my coded navigation prototype into smaller PRs for future releases. The work covered favorite dashboards and apps, flyout submenus, CMD+K search across PMM, and a technology hub template.
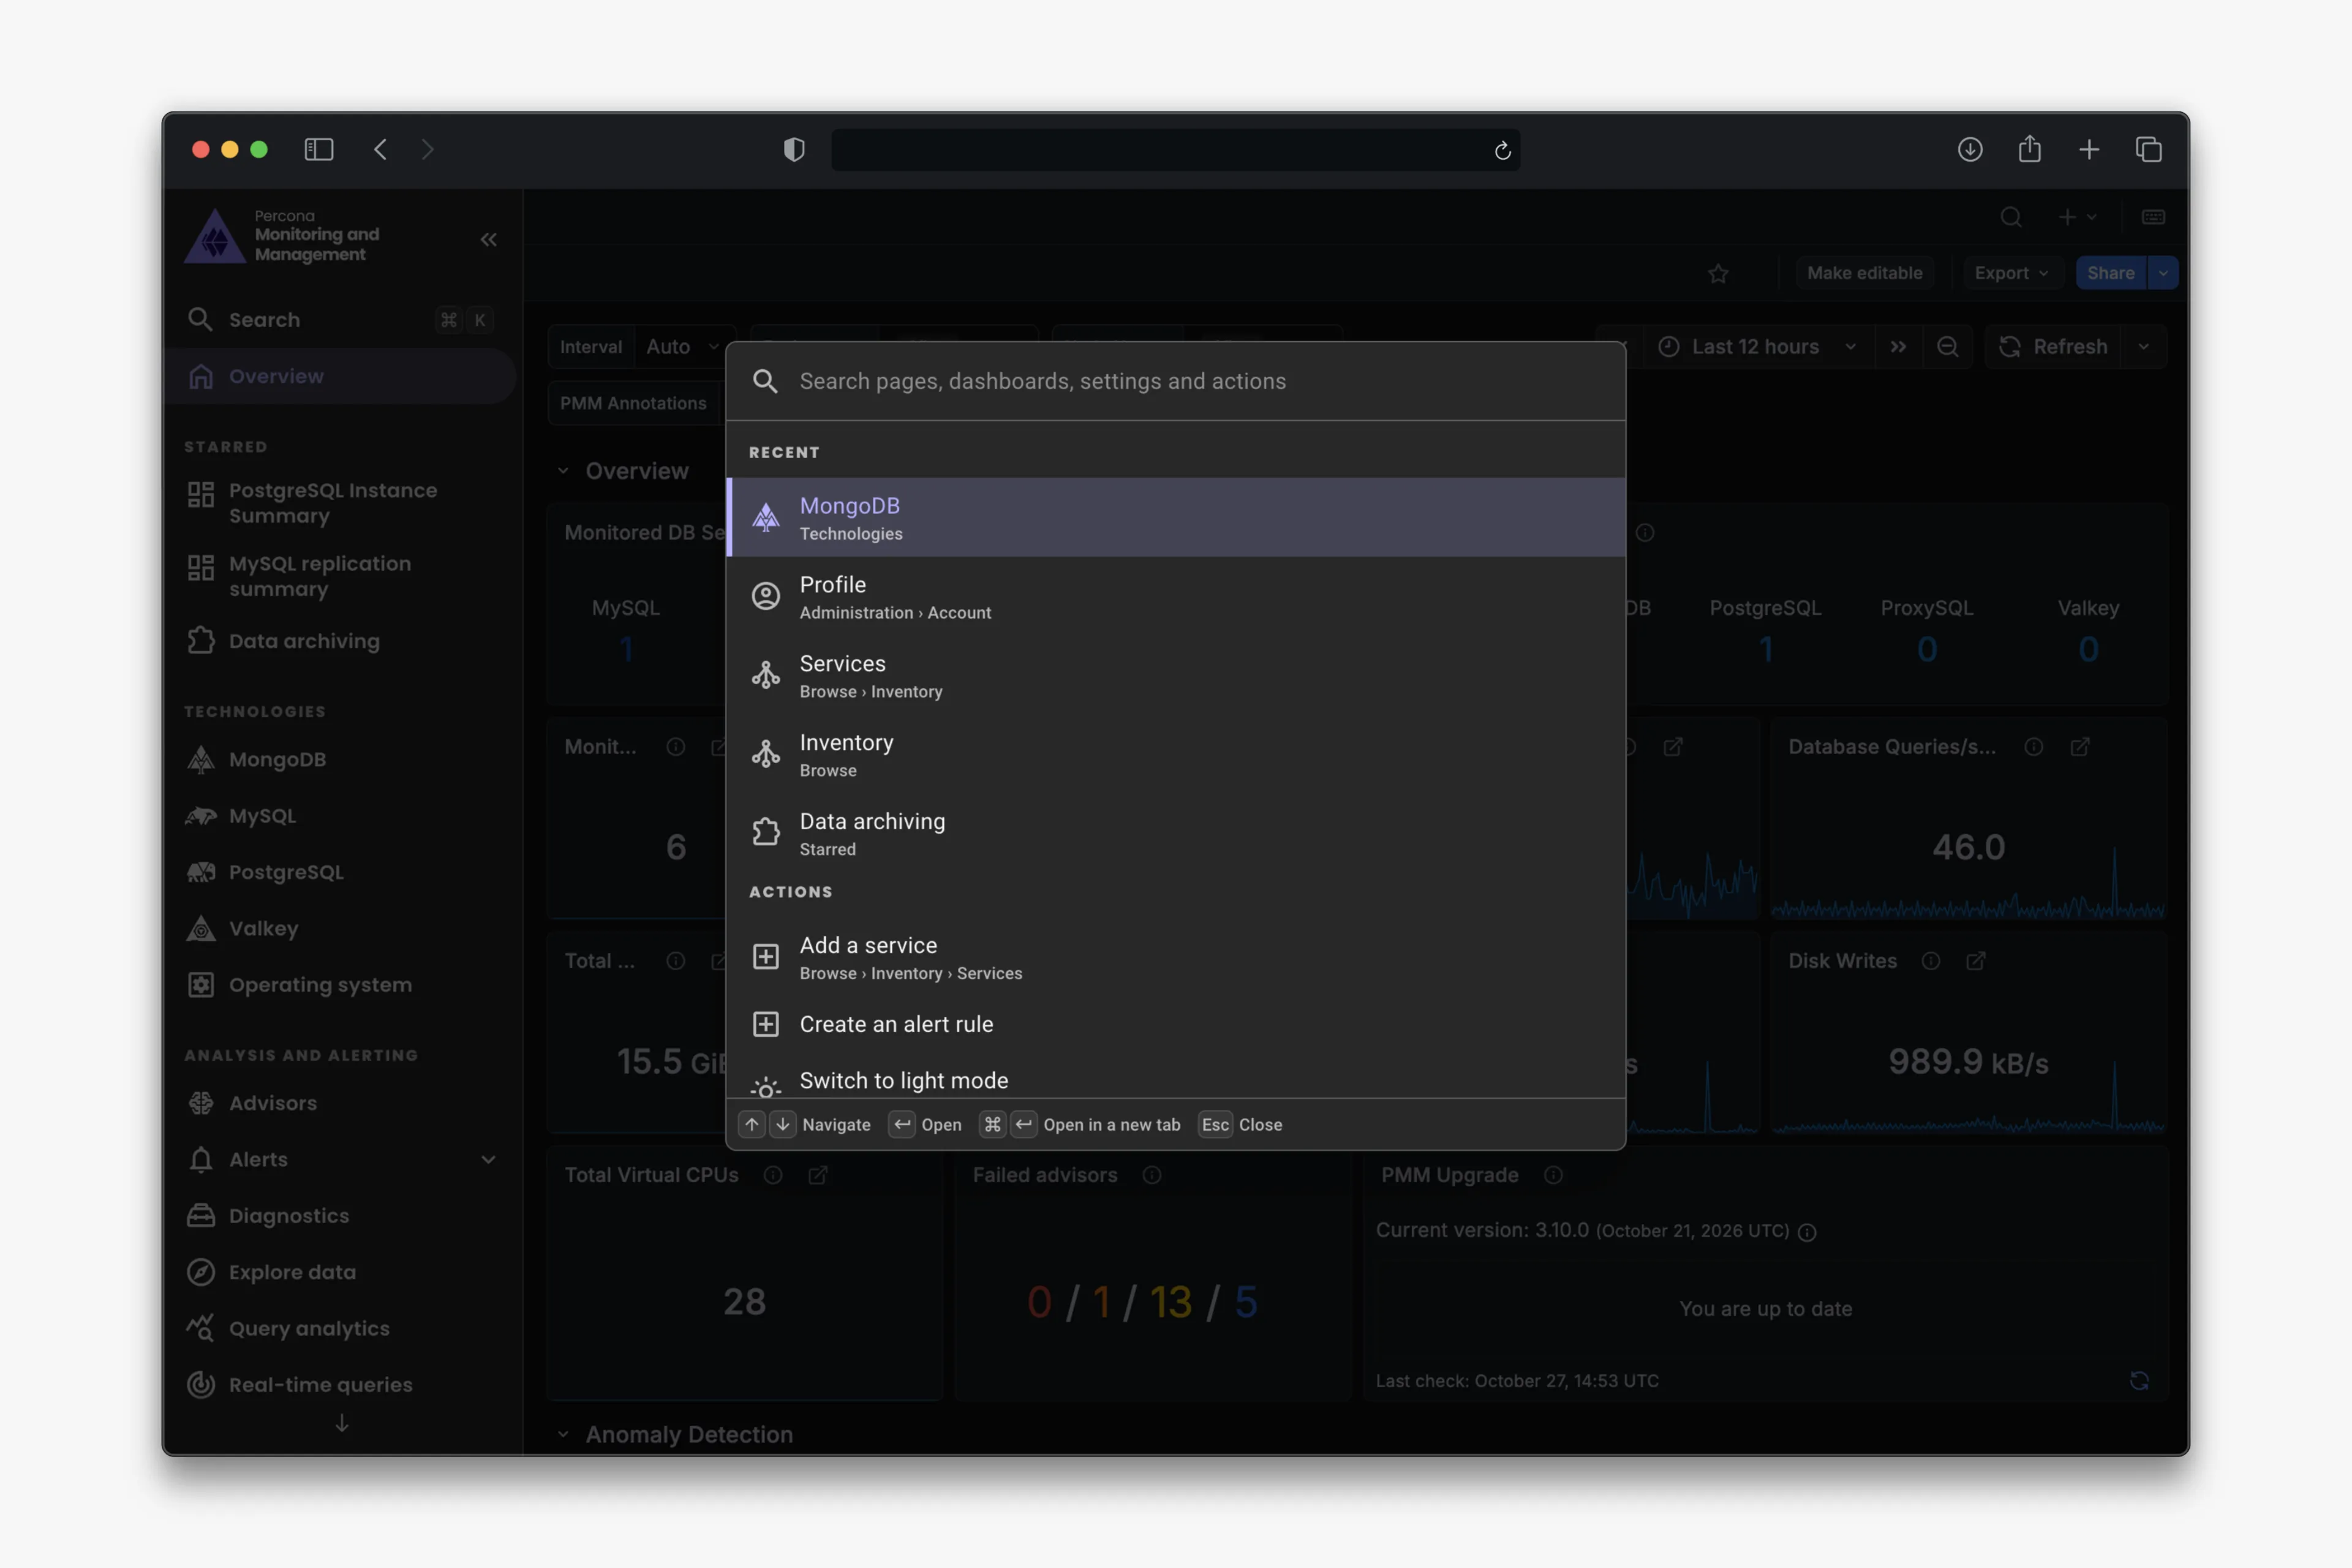
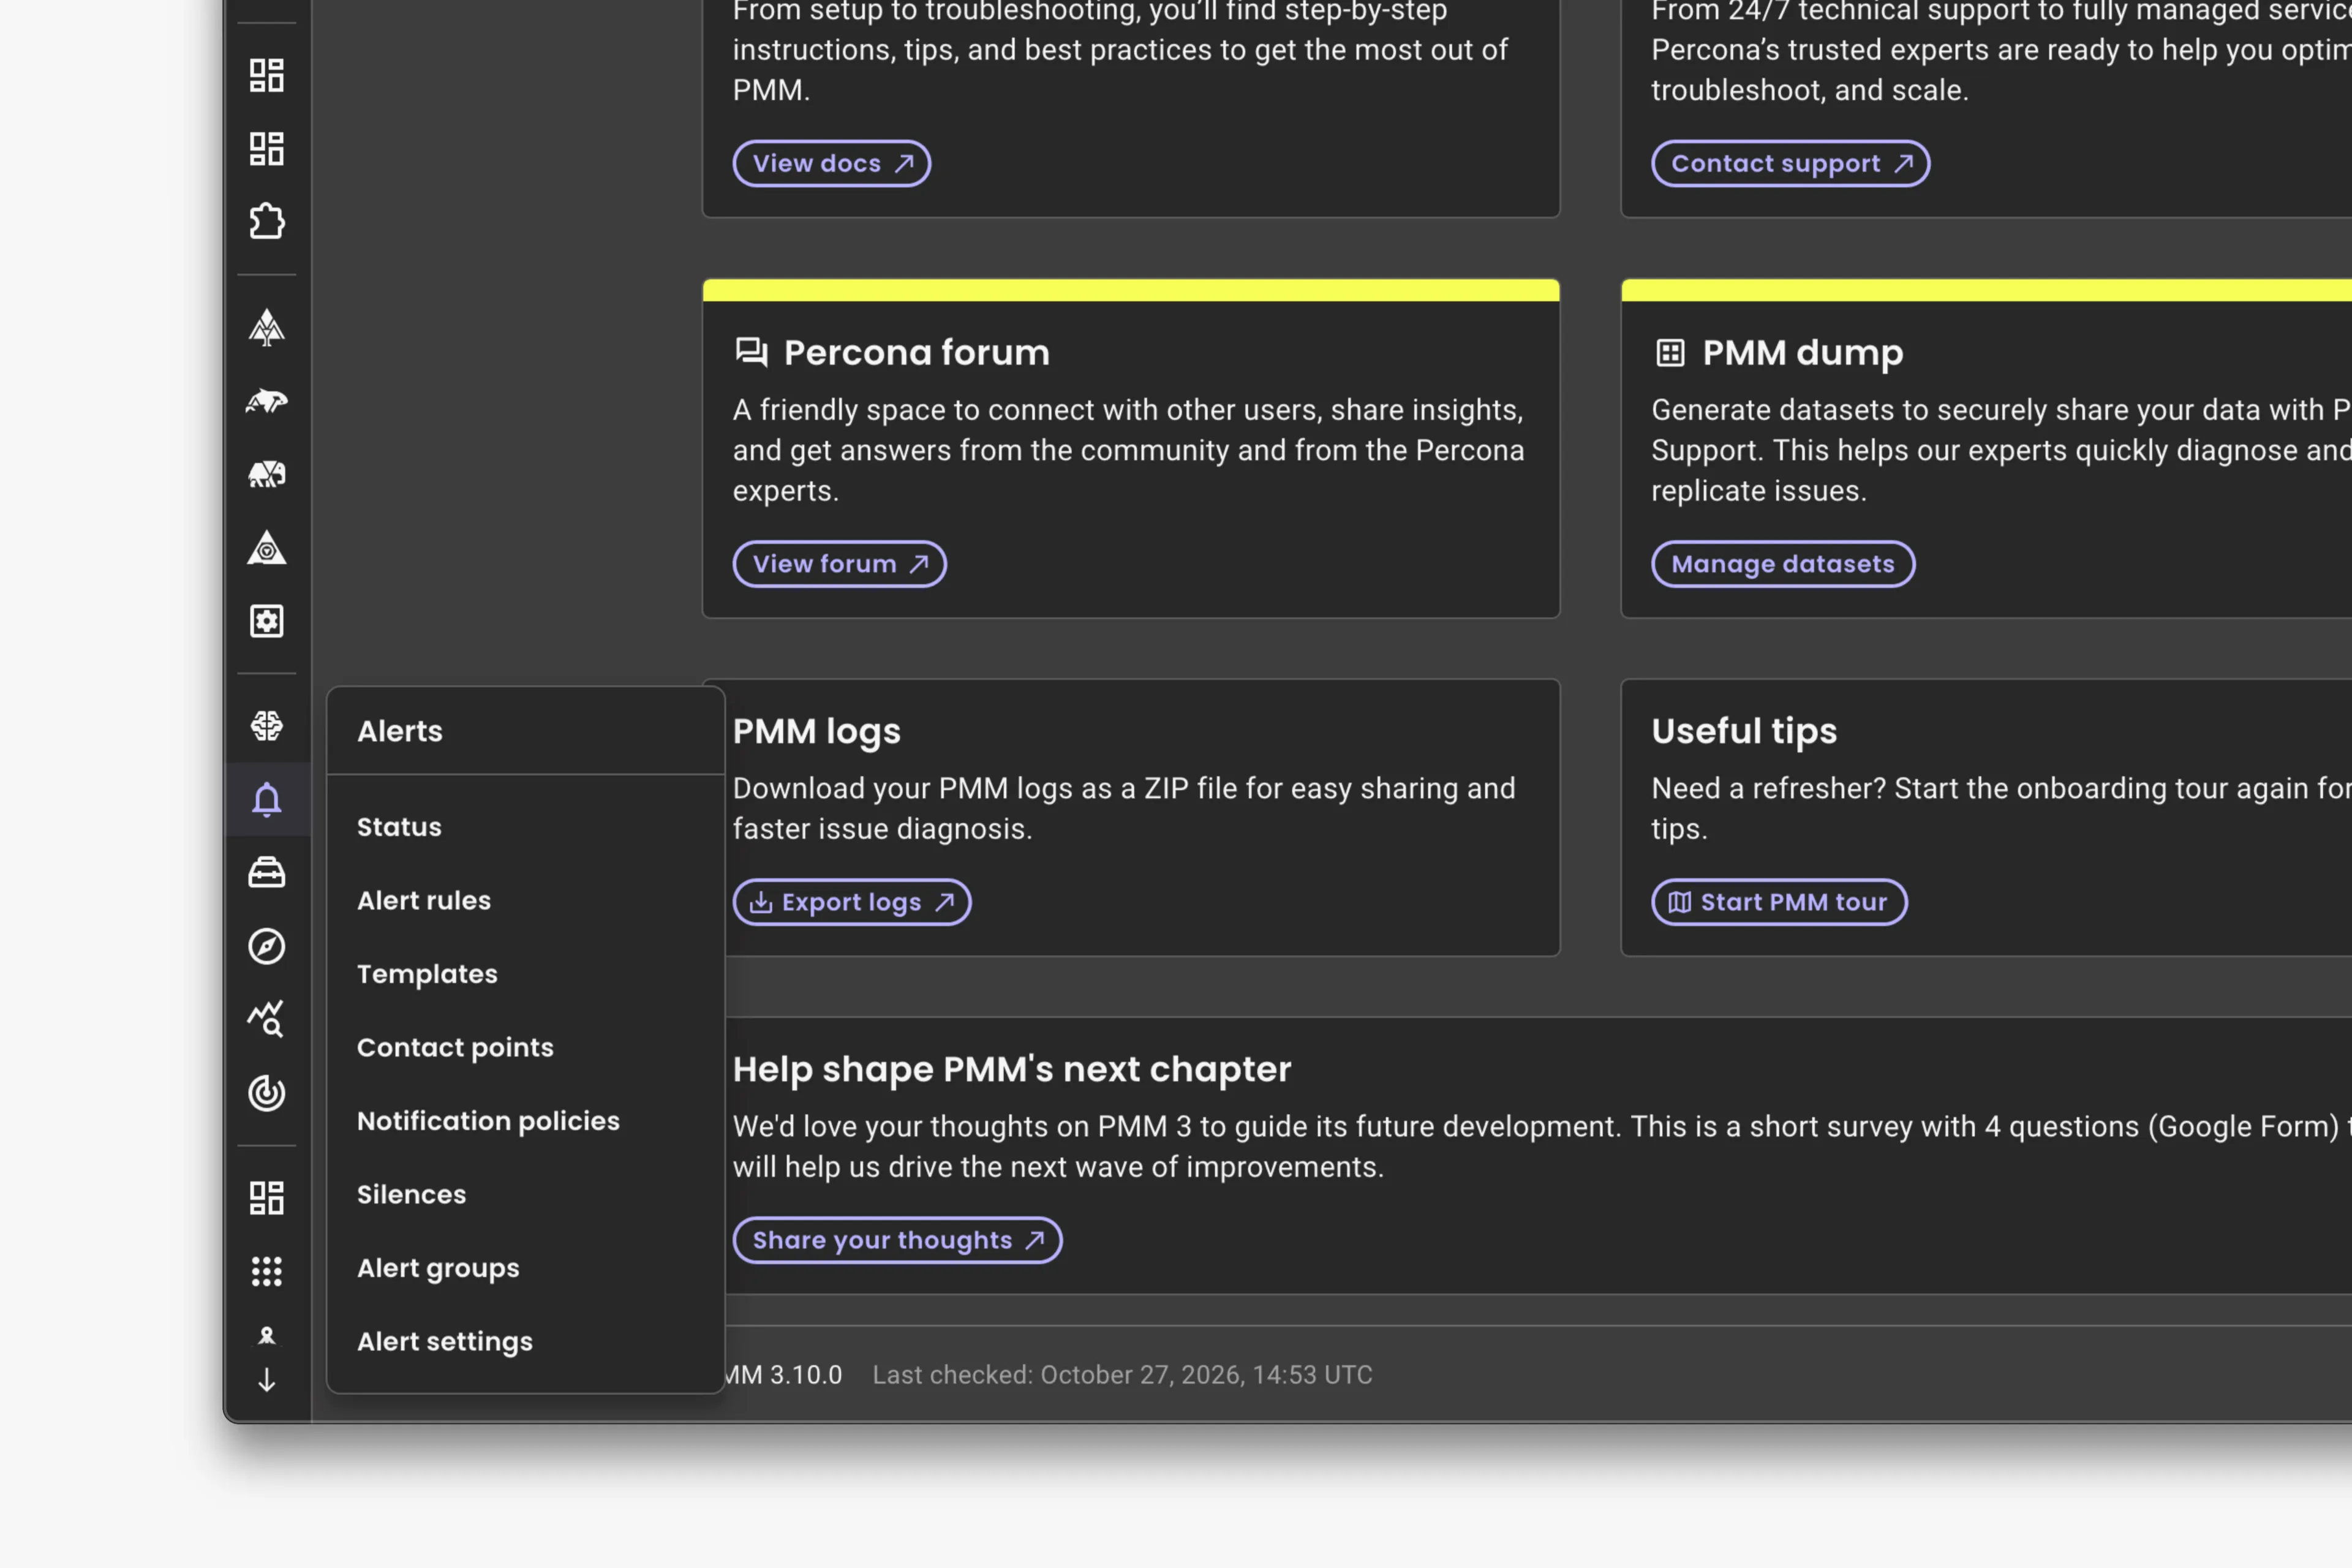
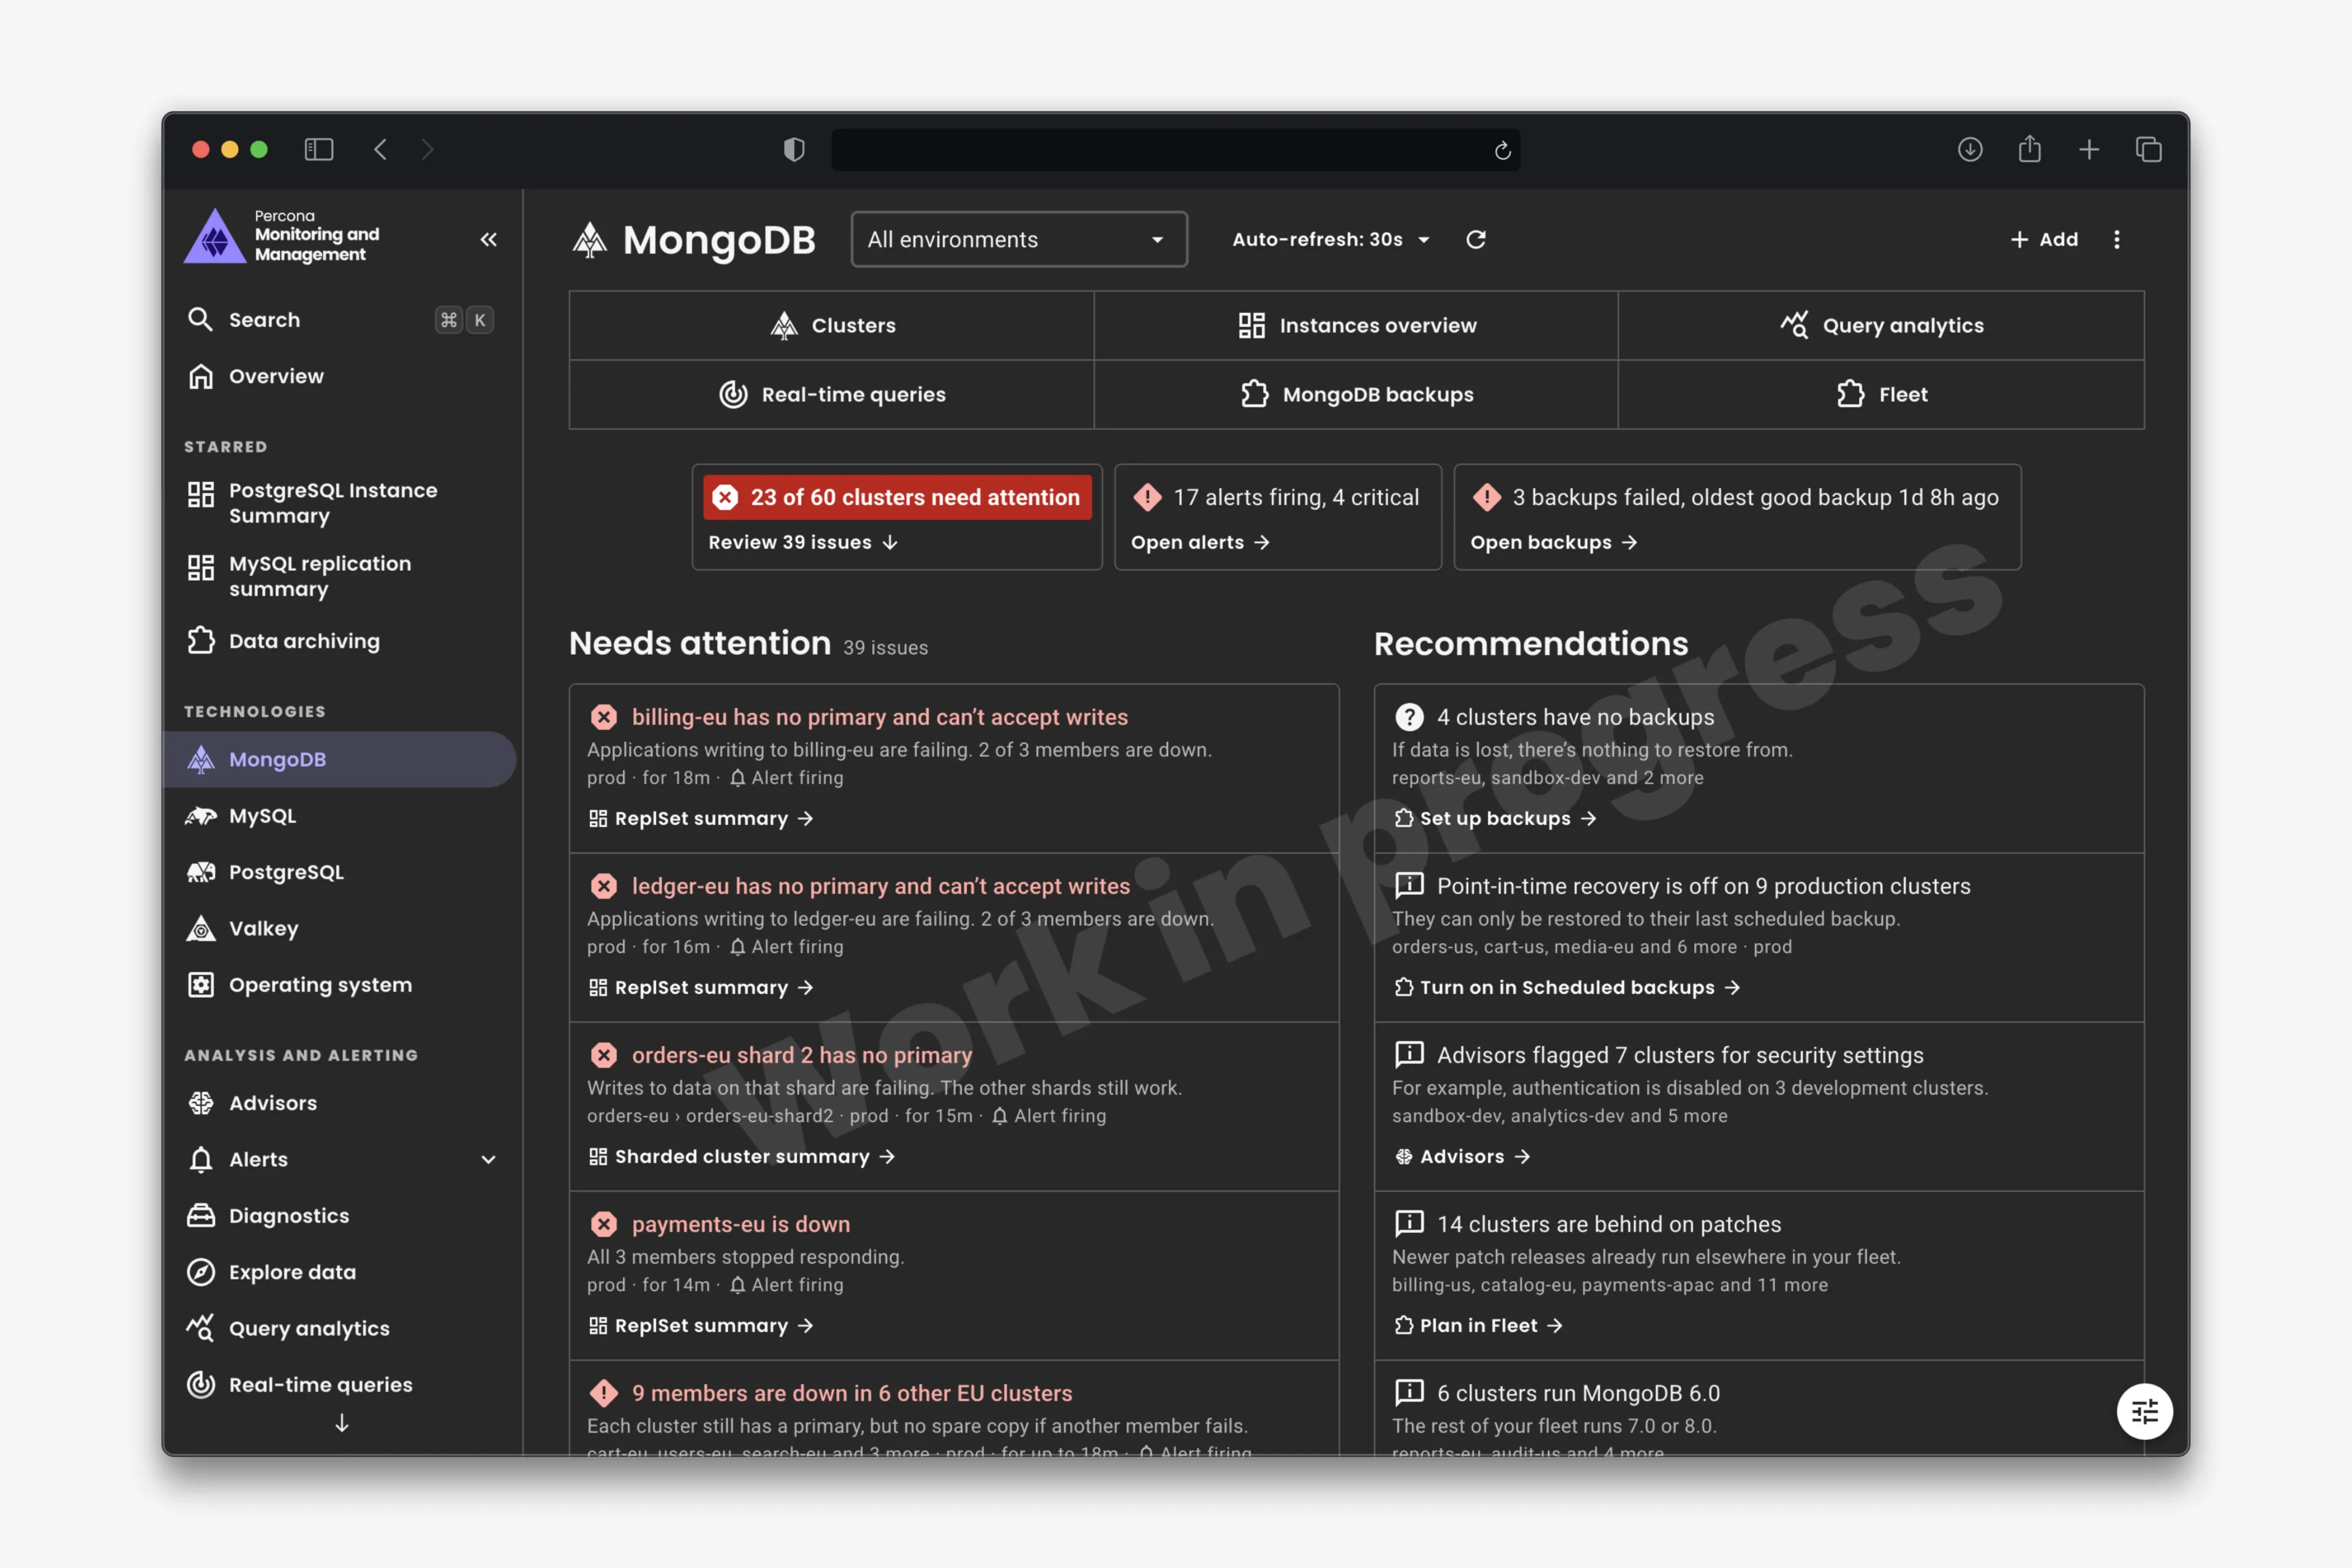
Navigation 2.0 prototype: first, CMD+K search; then flyout submenus in the collapsed sidebar; and finally a MongoDB hub highlighting issues that need attention.
This second phase allowed us to produce a tested architecture, a functional prototype and smaller implementation proposals.
Looking back
I would build the shared foundation early again. Peak UI supported the move to a native interface and gave two other teams a way to build inside PMM.
I would change when I tested the next information architecture. The evidence arrived while the sidebar was already shipping, limiting its influence on that release. Next time, I would test the structure alongside the first prototypes, while there was still room to change the delivery scope.
I would also make navigation growth an explicit part of the initial scope: how new apps enter the product, who needs to see them, and when they belong within an existing workflow or hub.